Register to “Follow the munKNEE“ and automatically receive all articles posted
This article is probably the most exhaustive and challenging piece I have written. It was worth the effort because understanding the business cycle is crucial to making great investment decisions. To get the full benefit, I urge readers to spend some time reading the 3 background links and watching the 8 videos. Words: 1279; Videos: 8; Charts: 2; Table: 1
So writes Jeff Miller (http://oldprof.typepad.com) in edited excerpts from his original article entitled Business Cycle Forecasting: The Superlative Results Of Robert F. Dieli.
This article is presented compliments of www.munKNEE.com (Your Key to Making Money!) and may have been edited ([ ]), abridged (…) and/or reformatted (some sub-titles and bold/italics emphases) for the sake of clarity and brevity to ensure a fast and easy read. Please note that this paragraph must be included in any article re-posting to avoid copyright infringement.
Miller goes on to say in further edited excerpts:
I am going to follow up with another piece describing how I use this information for investment decisions. For now, let us all focus on the method, understanding how and why it has worked so well throughout history.
Background
In May of 2011, I embarked on a search for the best recession forecasting methods. I had been a long-time fan of the ECRI approach. They were still very positive on the economy at the time, and my quest was not driven by their conclusions. I was uncomfortable with the methodology and the lack of transparency. I had many reader suggestions, and I reviewed them all. The criteria were stringent – “Jeff’s Acid Test.” The easy winner of this competition was Robert F. Dieli‘s “Mr. Model”. (This article described the competition and the results).
The main conclusion from Bob’s work was that there was no imminent recession. This ran counter to some other well-publicized and popular forecasts. Some readers complained in the comments that the history of the forecast included some imperfections. Others disagreed with the methods. The subject was too difficult for simple responses to these questions. I promised to follow up in more detail, but I wanted to do so in a convincing fashion.
A Year Later
A year later, some key elements of my rationale should be even more convincing:
- Bob was right – once again, as so many times before. And he did it in real time, not on a back-tested basis.
- Imperfections in real-time forecasting are acceptable – even desirable. When I see a perfect forecast, it always means that the model has been tweaked and changed to fit all of the past data.
- Simple is good. Methods that over-specify the number of variables and numerical trigger points also imply excessive back-fitting and poor predictability.
- Theory is important. The model should make sense.
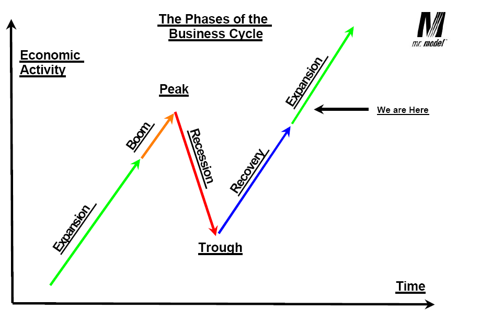
Most recession forecasting models fail because they emphasize weakness. This is backwards. A recession begins at a business cycle peak, something that I explain more carefully here. A recession starts with excessive strength. Seen any of that lately?
Dr. Dieli explains this quite clearly in this chart.
Your intuition about the business cycle would be better if you completely forgot the “R” word and took Bob’s lead: Substitute “business cycle peak.”
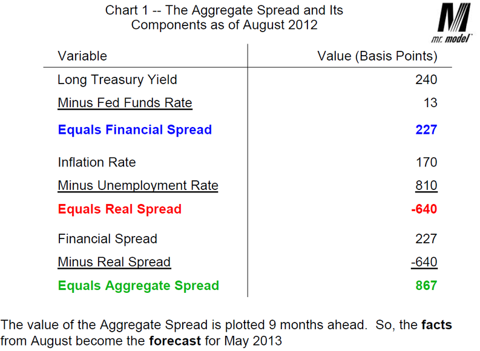
The key driver of Bob’s forecast is what he calls the “Aggregate Spread.” By reviewing results over decades, we can see that this method actually provides a warning of about nine months. The image below describes the composition of the spread, using example data from August.
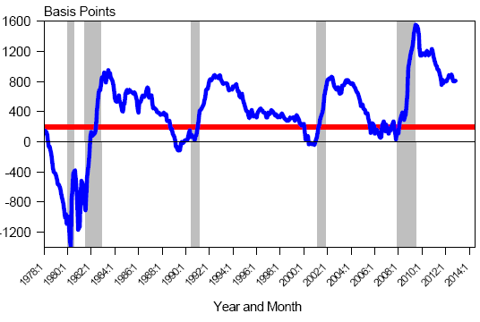
The most recent aggregate spread is shown below. Just as it did last year, it provides strong evidence that the US economy is not nearing a recession.
And Now – The Show
Get some popcorn and your favorite beverage and settle back to watch the show. I recently met with Bob Dieli to discuss economic forecasting and to create some videos. The result is an eight-part series in which we discuss each of the recessions of the latter 20th Century. (Thanks to Derek Miller for helping in the production of the videos and producing the key summaries.)
In the first video [see here: 4:43 minutes], Bob and I discuss National Bureau of Economic Research and why their definitions of a recession are important. The nonpartisan NBER looks at both the peaks and troughs of the business cycle to conclude when past recessions have happened, effectively making “autopsies, rather than forecasts” – as Bob says. Therefore, it is important for the Mr. Model to use the same criteria when it forecasts for recessions, providing a clearer picture than other models.
In part two [see here: 4:06 minutes], Bob and I take a close look at the recession of 1957. In doing so, they describe exactly how Mr. Model works. The model signals 9 months ahead that the business cycle will be heading towards a peak or trough when it crosses the 200 basis points (shown as a red line on the chart).
In the 3rd video [see here: 4:05 minutes] Bob and I illustrate the ways in which policymakers can and do impact the business cycle and how this interacts with Mr. Model. In the run up to 1960, tightening by the Federal Reserve as well as fiscal cuts by the Eisenhower Administration led to an economic downturn. In 1967, when the Fed again tightened the yield curve, the model signaled a recession. Shortly thereafter the Fed eased up, thereby avoiding a recession. At the end of the day, the NBER never called a recession in ’67.
Mr. Model had nearly spotless performance in predicting the recessions of the 1970s. Contrary to popular belief, the 1973 recession had less to do with OPEC and more to do with other government policies that laid the foundation for an economic downturn. [See video here: 3:55 minutes.]
Mr. Model shows the result of Fed Chairman Volcker’s monetary policy [see here: 4:16 minutes], which inverted the yield curve and brought the Fed funds rate to 20%. The result was a short 6-month recession, then a short recovery which was stifled by other policies. Interestingly enough, the recovery never took Mr. Model past 200 basis points – meaning a new peak could not have been established for the “second” recession.
After the “double dip” recession of the 80s, the recovery brought the business cycle to record highs [see video here: 4:43 minutes]. This led to the third-longest period of economic expansion into the summer of 1990. A combination of tightening monetary policy and changing policies regarding the first war in Iraq were both responsible in part for the downturn. In 2000, Mr. Model signaled a recession in an election year – something that was sure to happen regardless of who was elected. However, in both instances the model predicted short and shallow recessions unlike the seriousness of the early 80s.
In the most recent recession, Mr. Model’s results were decidedly different than they had been for any previous recession [see video here: 4:43 minutes]. The model alerted that the 200 basis point line had been crossed in 2007 but did not decline sharply. This is in part because tightening by the Fed did not affect the yield curve as they had in past events. Quick reactions by the Bush and Obama administrations also helped to prevent a dramatic decline in Mr. Model’s basis points.
In this final video [4:53 minutes], Bob and I focus heavily on the 2007-2009 recession. The model appears to show a false positive as it crosses the 200 basis point line in 2006, but continues sideways for some time before the recession was officially called. In a sense, this suggests severe instability rather than the dramatic declines of the past. In any case, we had ample warning that a recession was coming. It did not take us by surprise.
Conclusion
If you have studied the evidence, you will see that recessions usually involve the Fed.
You might also have noticed that business cycle peaks do not typically come from a problem of “stall speed” but one of excess stimulation.
Market observers are completely mistaken:
- Wrong indicators;
- Wrong interpretation (weakness versus strength);
- Wrong sources;
- Wrong point of the business cycle; and finally
- Wrong stocks.
These will be the subjects of the next installment.
Editor’s Note: The author’s views and conclusions are unaltered and no personal comments have been included to maintain the integrity of the original article. Furthermore, the views, conclusions and any recommendations offered in this article are not to be construed as an endorsement of such by the editor.
*http://oldprof.typepad.com/a_dash_of_insight/2013/01/business_cycle_forecasting_dieli.html
Register HERE for Your Daily Intelligence Report
- It’s FREE
- Provides the “best of the best” financial, economic and investment articles to be found on the internet
- Is in an “edited excerpts” format to provide brevity & clarity to ensure a fast & easy read
- Don’t waste time searching for informative articles. We do it for you!
- Register HERE and automatically receive every article posted
- “Follow Us” on twitter & “Like Us” on Facebook
Related Articles:
1. “Ponzi Finance”: What Must Happen To Bring It To An End?
The Boston Consulting Group has issued a paper that recommends 10 steps that developed countries must take to end what they refer to as ‘Ponzi finance’ and to return to a sustainable growth path but I believe their recommendations to be but theoretical and impractical constructs. While I believe we face – and will experience – interesting, speculative, fragile, and very challenging and very likely life-changing times going forward, I believe that the only thing that will force developed country politicians to work for common purposes is a further global financial crisis. This article provides an overview and assessment of said paper and the rationale for my position. Words: 600
2. Links to 5 of the “Best-of-the-Best” Articles on the Financial Plight of the USA
Given the hectic lives we lead you may well have missed some excellent articles on the financial plight of the U.S. and recent developments in the economy. Not to worry. Below are introductory paragraphs and links to 5 of the “best-of-the-best” articles on the subject.
 munKNEE.com Your Key to Making Money


