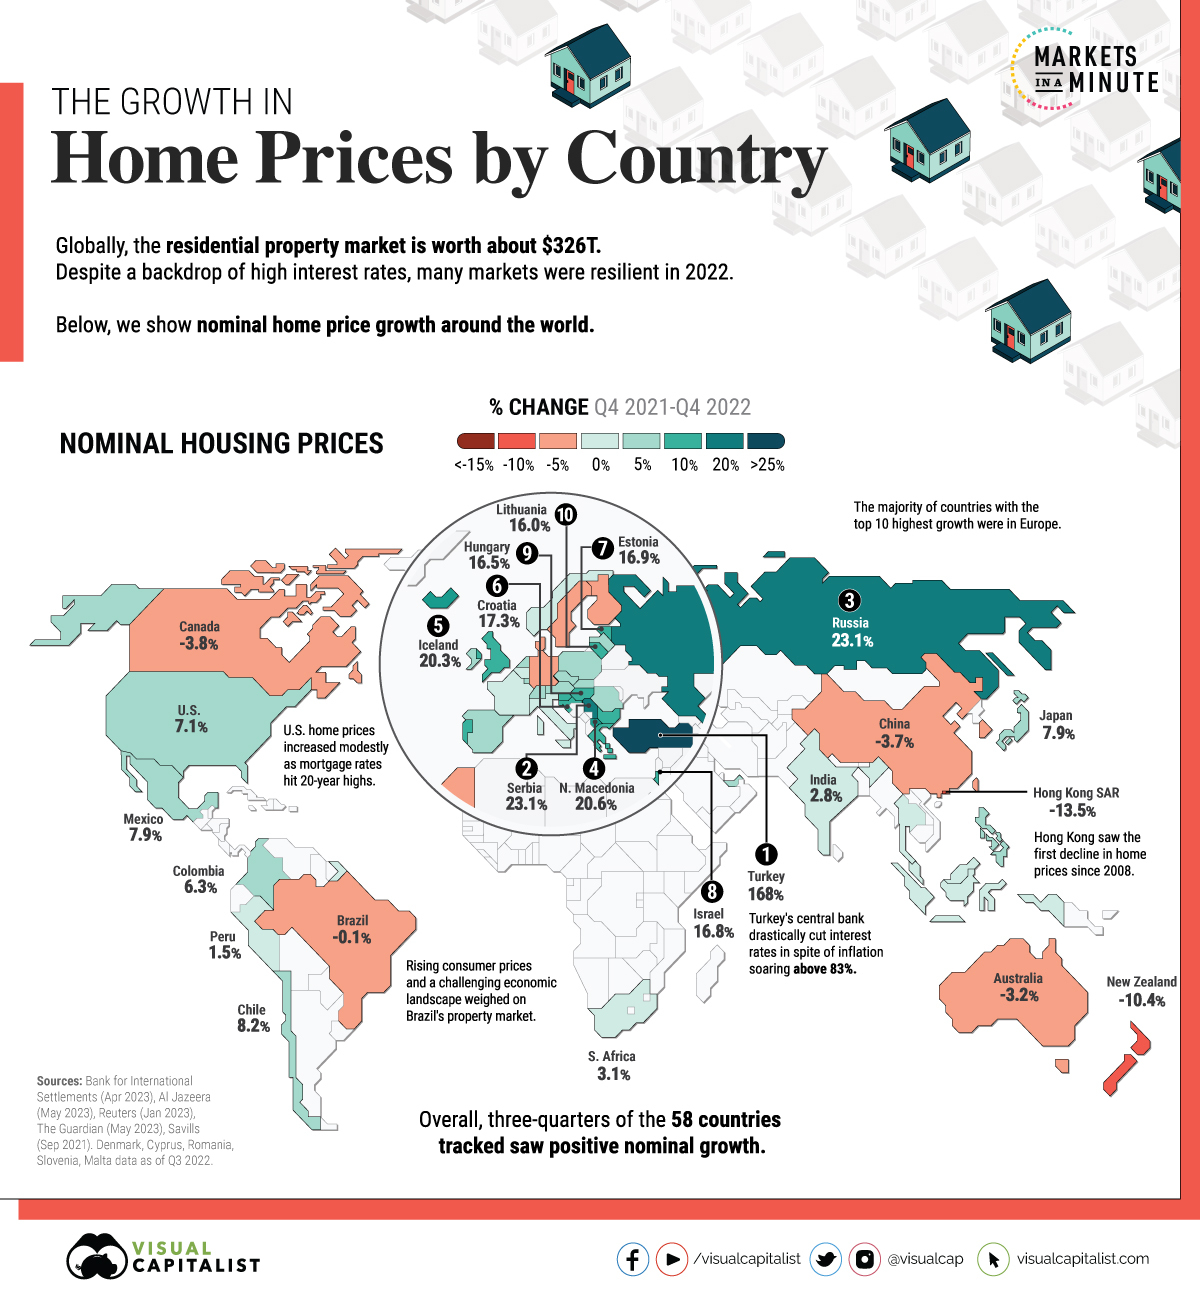
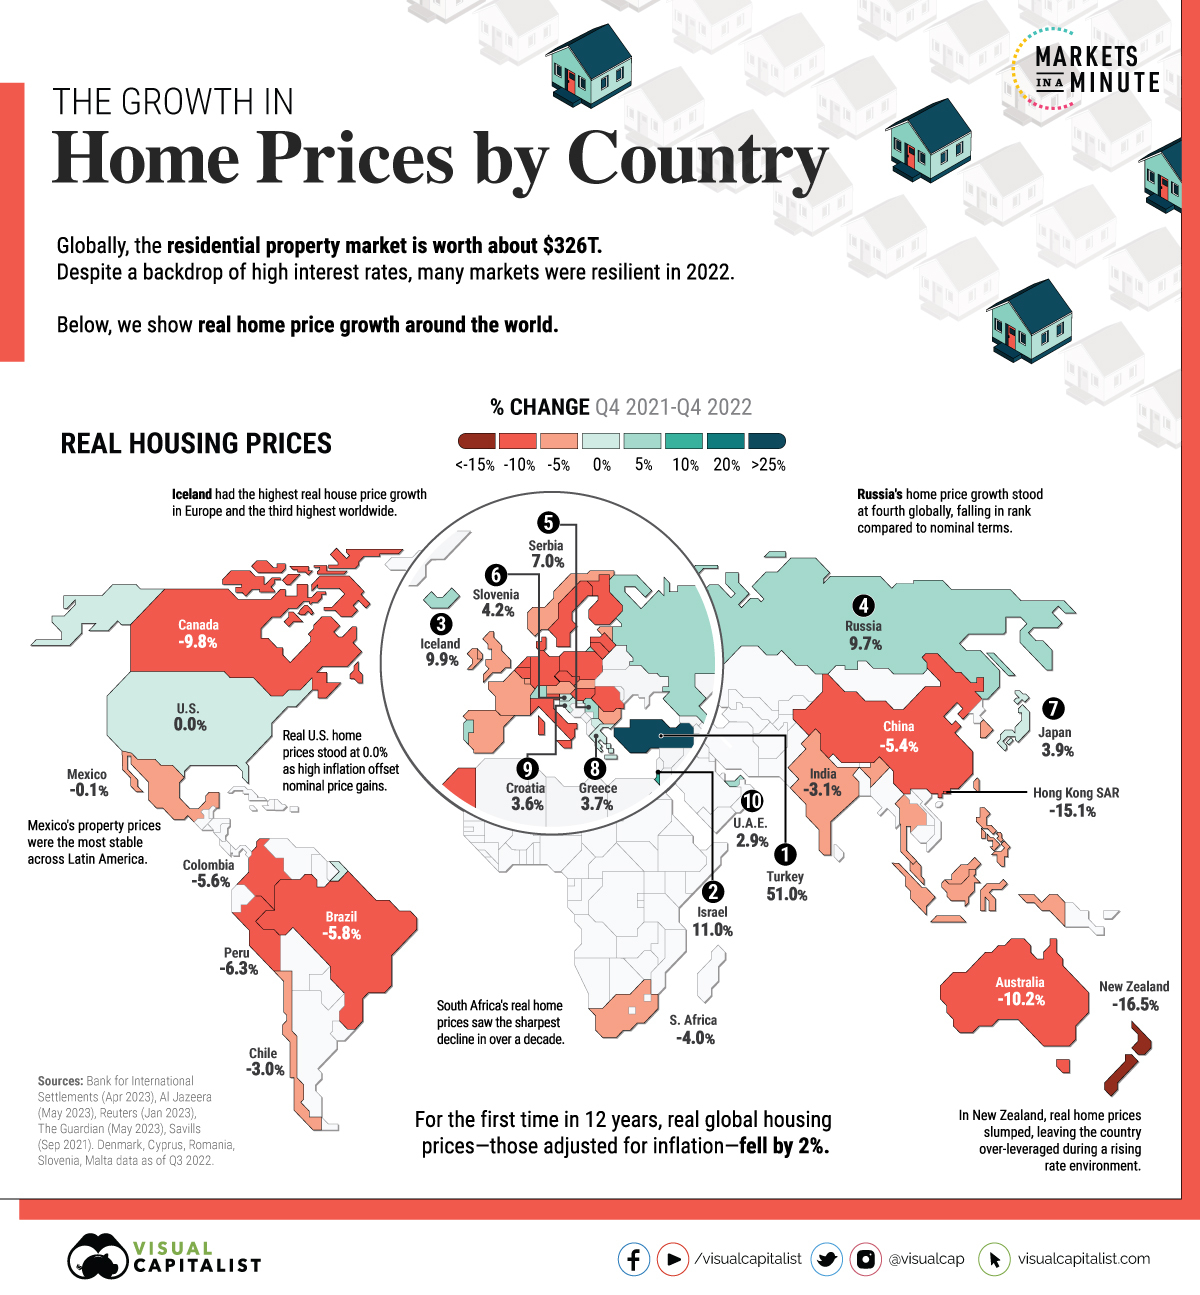
Global housing prices rose an average of 6% annually, between Q4 2021 and Q4 2022. but, in real terms that take inflation into account, prices actually fell 2% for the first decline in 12 years. In today’s graphic, we show the change in residential property prices with data from the Bank for International Settlements.
This post is an abridged version of the original article by originally posted on VisualCapitalist.com.
Nominal Housing Prices
The rise in U.S. interest rates has been counteracted by homeowners being reluctant to sell so they can keep their low mortgage rates. As a result, it is keeping inventory low and prices high. Homeowners can’t sell and keep their low mortgage rates unless they meet strict conditions on a new property. Additionally, several other factors impact price dynamics. Construction costs, income growth, labor shortages, and population growth all play a role.
With a strong labor market continuing through 2023, stable incomes may help stave off prices from falling. On the other hand, buyers with floating-rate mortgages face steeper costs and may be unable to afford new rates. This could increase housing supply in the market, potentially leading to lower prices.
 munKNEE.com Your Key to Making Money

