There are many ways to document the under-performance of the gold and silver mining space. One way is to look at long term charts and measure the run-up or the correction. Another way to measure the under-performance, is in terms of [the price of physical] gold.
By George Kesarios (Read the original unedited version on SeekingAlpha.com HERE.)
Two of the most followed commodity stock indices are the Philadelphia Gold/Silver XAU Index and the AMEX Gold Bugs HUI Index. The difference between the two is that:
- the HUI is a pure gold stock index and
- the XAU has both gold and silver mining companies.
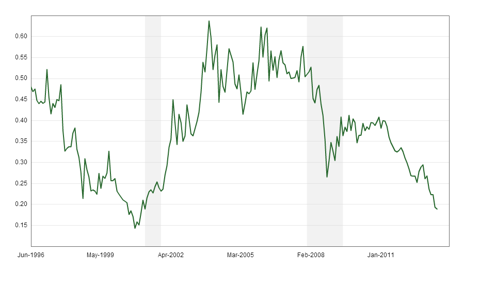
HUI Index to Gold Ratio
The chart below shows the ratio of the HUI index to gold. This is really a very oversold ratio. As you can see, the ratio is approaching the lows of 1999.
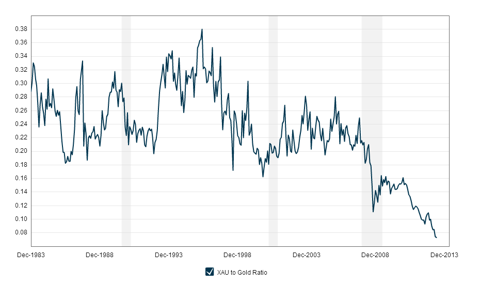
XAU to Gold Ratio
…If you really want an eye-opener, the next chart says it all. The ratio of the XAU to gold is at all time lows going back to 1983.
Charts from here
It is very difficult to answer the question “Are the stocks that comprise these two indexes — the HUI and XAU – over-sold enough to warrant buying them?” because, as I have said in previous posts (here, here and here), I think gold is going much lower.
Conclusion
…Since the stocks that comprise the two above charts are at all time over-sold relative levels, and they have corrected much more than gold, if you know your gold stocks, “digging” around for opportunities is probably worth your time.
The above post has been edited by Lorimer Wilson, editor of munKNEE.com (Your Key to Making Money!) and the FREE Market Intelligence Report newsletter (see sample here – register here) for the sake of clarity ([ ]) and brevity (…) to provide a fast and easy read.
*http://seekingalpha.com/article/1406401-chart-of-the-day-the-xau-to-gold-ratio
Related Articles from the munKNEE Vault:
(Also check out this article just posted on SeekingAlpha.com)
1. Junior Miners Are the Place To Be Over the Next 3-5 Years
The bottoming process for the junior miners after a seven year decline may be ending in the next few months as they once again come back into favor for the following ten reasons.
2. Gold Stocks Are the Cheapest EVER Seen!
When comparing the S&P 500 to the Barron’s Gold Mining Index (BGMI), the ratio reached a high of 6.32 during the 1987-2000 bull market. The ratio today is 6.39. The higher the ratio, the cheaper gold companies are which means…we are seeing the cheapest gold stocks ever!
3. Lows In Gold Shares May Already Be In – Here’s Why
The HUI Gold Bugs index has fallen twice as much as gold’s bear market loss of 43% but, looking at the charts, both are saying the lows may already be in.
4. It’s Time To Buy Gold & Silver Stocks – Here’s Why
The bear market for gold is long in the tooth…and gold stocks are the most undervalued they have been in decades.
5. It’s Time To Start Thinking About Buying Gold Mining Stocks – Here’s Why
Is this the time to be buying gold mining stocks? Maybe, maybe not, but if you don’t own any at all, this is a good time to start thinking about them. Here’s why.
6. How to Play the Beaten Down Precious Metals Sector With Less Risk
Investors are faced with a serious challenge: how exactly to play the beaten down precious metals sector? If anything, investors must avoid too much risk when putting capital at work so here are 4 rules on how to go about doing so in…a disciplined way.
7. 3 Signs That Gold, Silver & PM Stocks Have Finally Bottomed
Gold, silver and precious metals mining stocks are still nowhere near long-term or secular bottoms but I believe they could be approaching short-term tradable bottoms in the coming days or weeks based on the following 3 signals:
8. The Gold-Silver Ratio: Here’s What It Indicates Could Happen Soon
The gold-silver ratio is the relative valuation of the two precious metals, and in consideration of the described trading pattern it can provide an indication of the maturity of a bull or bear cycle. Market tops for gold and silver are typically accompanied by low gold-silver ratios (silver outpacing to the upside), and market bottoms are typically accompanied by tops in the gold-silver ratio (silver outpacing to the downside). So what is the gold-silver ratio saying these days?
 munKNEE.com Your Key to Making Money

