…When the USD starts to rise many assume that this is negative for paper gold ETFs  such as GLD as well as physical gold. I’m sure you have heard it before, if the USD goes up then gold goes down, and vice versa…but, in reality, this “rule of thumb” isn’t the case and, in actuality, it would be impossible for the USD and gold to trade inversely with each other. Let me explain.
The above introductory comments are edited excerpts from an article* by “SomaBull” as posted on SeekingAlpha.com under the title Debunking The Theory That The U.S. Dollar And Gold Have An Inverse Relationship.
“SomaBull” goes on to say in further edited excerpts:
Why The Assumption?
We first have to ask why so many economists, analysts, and investors believe the above “rule of thumb”. The theory is that
- a rising USD makes investing in Gold/GLD less attractive, as a strong currency means less monetary and economic uncertainty and, conversely, that
- a falling USD makes investing in Gold/GLD more attractive, as a weak currency means inflation and economic uncertainty.
There are 2 major flaws in this theory. The fact is:
- global currencies are all being debased, and
- a strong currency still means inflation.
A Race To The Bottom
In 2008, we almost had a complete meltdown of the entire financial system. If it wasn’t for the quick action by the Federal Reserve and other central banks around the globe, we would have had a severe depression… Trillions upon trillions of fiat currencies have been printed by the major central banks since 2008. This is a race to the bottom. There is going to be no winner in all of this…
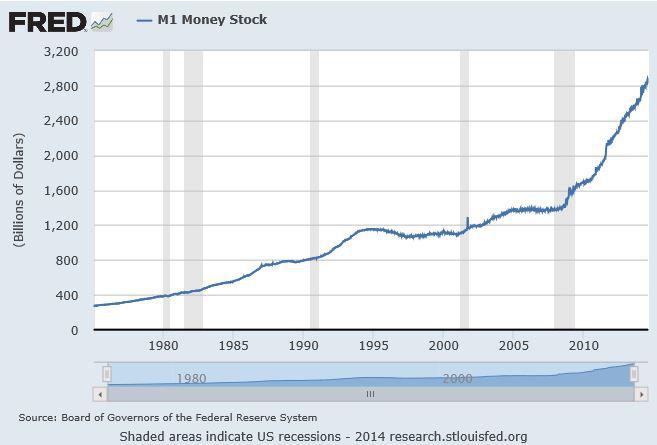
U.S. Money Supply
Let’s take a closer look at the U.S. money supply, M1 and M2. As you can see below, M1 has exploded since 2008. In theory, the USD should be down given this growth in money supply.
(click to enlarge)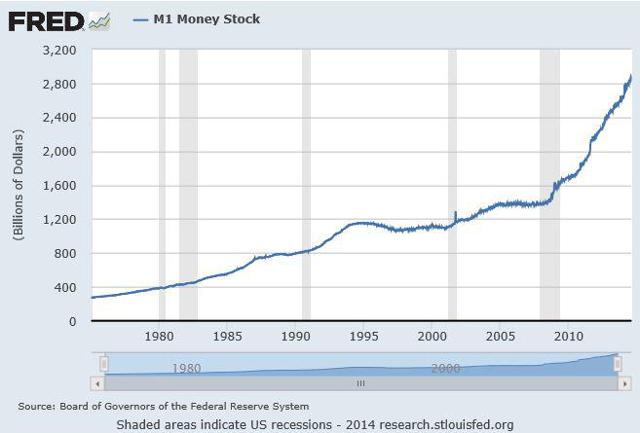 (Source: FRED)
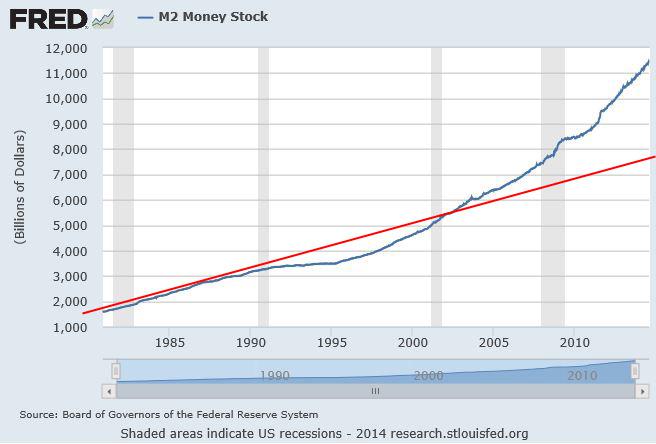
Now, let’s look at M2. I added the red line into the chart below to show the trend line for M2 growth over the last 35 years. You can see that from 1980 to early 2000s, M2 stayed close to this trend line. Then around 2005 it was above it, and now in 2014 it is substantially above the normal trend. M2 should be around 7,500, instead it’s over 11,000.
(click to enlarge) (Source: FRED)
The US Dollar Index
The US Dollar Index has moved higher in the last 5-6 years since the 2008 financial crisis, and is up a lot from the 2008 lows. Given the money supply growth (which is inflation), the USD should be lower, but it’s not. The reason is because every other major currency in the world is also being debased by the trillions, just like the USD. The USD just happens to be picked as the best of the worst right now.
[For example,] if the Fed came out tomorrow and said it was going to print $2 trillion USD, and the ECB, the BoJ, and the BoE all came out and said they were each going to print $4 trillion [in their respective currencies], then the US Dollar Index would go up. However, the purchasing power of the USD compared to gold would go down given the increase in the amount of currency that was created. Gold would rise even though the US Dollar Index was also moving higher.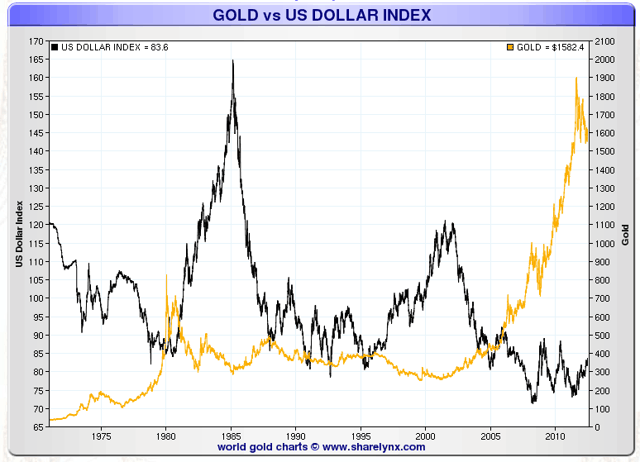 (Source: Sharelynx.com)

While it’s possible that the US Dollar Index might not go down anytime in the next 20 years, the value of the USD most certainly will. They are two separate things. That’s what people get confused about. Gold measures the purchasing power of the USD, not where the USD is trading against a basket of other fiat currencies [the US Dollar Index]. That’s why there is no correlation with gold and the US Dollar Index.
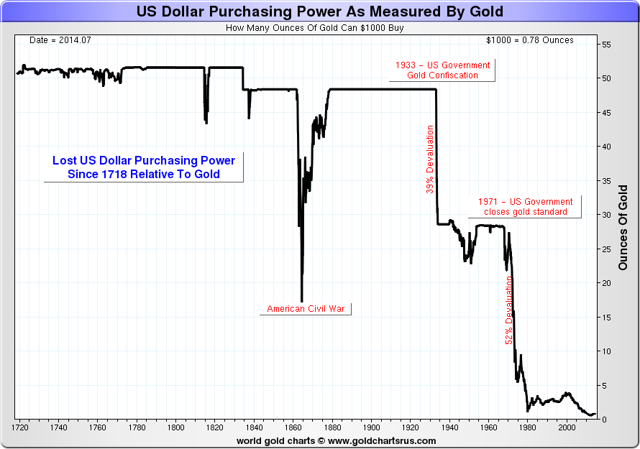 (Source: Goldchartsrus.com)

Follow the Money Supply If You Want To See Where Gold Goes
An increase in the money supply is inflationary, pure and simple, and gold is going to follow the money supply. In 2008, when the U.S. got a whiff of possible deflation, gold was crashing. When M1 and M2 took off after the Fed unleashed the printing presses, so did gold.
(click to enlarge)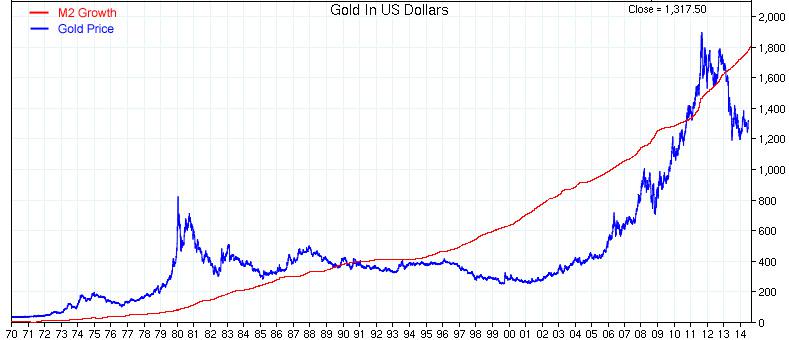
Conclusion
We live in an inflationary system and will never see M2 decline or remain flat for too long and, as such, while gold doesn’t follow the money supply to a “T” (it will have wild gyrations above and below it) over time it will continue to trend higher with it.
Editor’s Note: The author’s views and conclusions in the above article are unaltered and no personal comments have been included to maintain the integrity of the original post. Furthermore, the views, conclusions and any recommendations offered in this article are not to be construed as an endorsement of such by the editor.
*http://seekingalpha.com/article/2447055-debunking-the-theory-that-the-u-s-dollar-and-gold-have-an-inverse-relationship?ifp=0 (© 2014 Seeking Alpha) About “SomaBull”: I have been a successful Private Investor in the market for the last 17 years. My focus has mostly been on the Tech/Internet sector since I started, but 10 years ago I also branched out to the Gold and Silver sector and consider myself a premium authority for everything gold and silver related.
If you liked this article then “Follow the munKNEE” & get each new post via
- Our Newsletter (sample here)
- Twitter (#munknee)
Related Articles:
1. What Do Current Low Interest Rates Mean For the Future Price of Gold?
Investors commonly assume that rising interest rates adversely impact the gold price, and vice versa. They believe that a rising interest rate environment is indicative of a strong economy, which is supposed to drive investors out of gold and into the stock market. They further assume that investors will want to exchange their gold, which has no yield, for stocks and bonds, both of which have yields and generate income but this intuition is unfounded. Let me explain why that is the case ans why, as such, gold investors shouldn’t fear rising interest rates. Read More »
2. Goldbugs Should Pray for Higher Interest Rates – Here’s Why
Interest rates cannot stay low forever so, while the Fed’s low interest rate policy is pushing stock and bond prices higher, it is also infusing potential energy into the gold market. Therefore, it is only a matter of “When?” and not “If?” this trend reverses and gold catapults higher. Read More »
3. Historical 92.3% Gold/Oil Correlation Suggests Gold Is Currently Undervalued By?
Since 1970 there has been a 92.3% correlation between the price of gold and oil. The current gold to oil ratio is 11.8. If the ratio were to resume its historical average of 15.5, the gold price would be… Read More »
4. This is the Most “Stupid” USD Chart Around – Here’s Why
You’ve almost certainly seen the chart below over the years – it shows the purchasing power of the US Dollar over time – and it looks terrifying. I call it the “stupid” chart, though, because it is a total misrepresentation of the facts because it isn’t telling the full story. Here’s why. Read More »
5. Any Further Weakness In U.S. Dollar Would Signal Acceleration Of Downtrend – Got Gold?
The U.S. Dollar Index has fallen through support at 80 once again. If this current decline trend continues it will drop below 79.20 for the first time in nearly two years. This could pave the way for a deeper decline below the 76 level and signal a continuation of the downtrend that started in 2002. Read More »
6. Are Stock Market & U.S. Dollar About to Crash? Will Gold Be the Major Benefactor?
Something is clearly out of whack. Gold has failed to push higher against the backdrop of a lower U.S. dollar for the first time in over a decade and, with pressure on the dollar increasing, the failure of support could ignite a massive decline. Is gold preparing to launch this time? Read More »
7. The Future Price of Gold and the 2% Factor
It is my contention that the price of gold rallies whenever the U.S. dollar’s real short-term interest rate is below 2%, falls whenever the real short rate is above 2%, and holds steady at the equilibrium rate of 2%. Let me explain. Read More »
8. Is There a Direct Link Between Rising Inflation and a Rising Demand For Gold?
History clearly shows there is a direct link between inflation and gold demand. When inflation jumps, or even when inflation expectations rise, investors turn to gold in greater numbers. When gold demand rises, so does its price and you can guess what happens to gold stocks. Below is a look at the extent of consumer purchases after inflation (and in some cases hyperinflation) took off in a number of countries. Read More »
If the past long-term cyclical correlations between interest rates, equities, and commodities were to play out as they have done going back to the 1880s, U.S. stocks and interest rates should continue to rise as commodities either fall or underperform according to a 60-year cyclical pattern model referred to as The Market Map. Read More »
10. Gold Shares Have Bottomed & Will Now Outperform Physical Gold Over Next 5.5 Years
2014 could end up being the turnaround year for precious metals and a bull market ascent could develop in 2015 – especially so in gold shares. Here’s why. Read More »