There is a remarkable correlation between the prevailing level of global liquidity (defined as the sum of the U.S. monetary base and the foreign holdings of U.S. Treasuries) and the price of gold per troy ounce. The current correlation suggests a gold price of $1,780 as illustrated by the chart below.
So writes Frank Holmes (usfunds.com) in edited excerpts from his original article* entitled How Far is Gold Off Course?.
[The following article is presented by Lorimer Wilson, editor of www.munKNEE.com and the FREEMarket Intelligence Report newsletter (sample here) and may have been edited ([ ]), abridged (…) and/or reformatted (some sub-titles and bold/italics emphases) for the sake of clarity and brevity to ensure a fast and easy read. This paragraph must be included in any article re-posting to avoid copyright infringement.]
Holmes goes on to say in further edited, and in some cases paraphrased, excerpts: Gold has been in extremely oversold territory lately despite drivers for the metal remaining in place. [Below is a chart illustrating]…a different way to look at how far gold has been off course. The chart tracks the correlation of the price of a [troy] ounce of gold to global liquidity. Since June 2000, as the U.S.’s monetary base and foreign holdings increased, so did the price of gold. The correlation suggests the current level of liquidity supports a gold price of $1,780 per ounce, well above the current spot price around $1,300.
According to Canaccord Genuity, the U.S. economy is “growing at lower than targeted rates,” which means that further quantitative easing will likely be required. In addition, citing a recent White House Office of Management study, Canaccord says that over the next decade, a tremendous $6.6 trillion will be added to the federal debt. “We estimate that the only way to fund the current QE3 program (as well as future government spending) is through the printing of money, therefore further increasing global liquidity,” writes Canaccord. To the research firm, this correlation trend points to “a greater potential for an increase in gold price versus a further decline.” Compounding the extraordinary debt in the U.S. is Europe. Government debt-to-GDP across 17 European countries climbed to 92.2%, hitting “all-time highs in the first quarter of 2013 even after austerity measures were introduced to rebalance the governments’ books,” reported CBS News. Bottom line: government liquidity and debt will likely continue to drive the Fear Trade for gold [which will result in dramatically higher prices over the next few years].
[Editor’s Note: The author’s views and conclusions in the above article are unaltered and no personal comments have been included to maintain the integrity of the original post. Furthermore, the views, conclusions and any recommendations offered in this article are not to be construed as an endorsement of such by the editor.]
An analysis of the ratio between the market capitalization of gold (MCG) and the gross world product (GWP) over the past 63 years suggests that the current price for gold has further to fall and that it would not be wise to begin buying gold until prices have fallen below at least $1100 or $950. Read More »
You are going to see the price of gold go up… a lot and it may go up a lot in a very short period of time. It’s not going to go up 10% per year for seven years and the price doubles. It’s going to chug along sideways, maybe in an upward trend, with a lot of volatility. It will have a kind of a slow grind upward… and then a spike… and then another spike… and then a super-spike. The whole thing could happen in a matter of 90 days — six months at the most. Read More »
While the US$3000 figure is wildly above most forecasts, which are mostly flat at the current level, UBS global commodity analyst Tom Price said these flat forecasts are based less on informed analysis than on the fact that “people just don’t know what’s going on.” Read More »
That governments will want – and will NEED – much, much higher gold and silver prices in the future is counter intuitive, given that they have done everything within their power to throttle back and to keep a lid on bullion prices. Let me explain why. Words: 1300
What would happen to the market/spot price of gold if central banks around the world diverted their foreign currency reserves – almost $11 trillion’s worth – into gold. Using James Turk’s Gold Money Index the “fair” gold price would be $10,783/ozt. Read More »
This is not a typical bull market. Gold is not rising in value, but instead, currencies are losing purchasing power against gold and, therefore, gold can rise as high as currencies can fall. Since currencies are falling because of increasing debt, gold can rise as high as government debt can grow. Based on official estimates, America’s debt is projected to reach $23 trillion in 2015 and, if its correlation with the price of gold remains the same, the indicated gold price would be $2,600 per ounce. However, if history is any example, it’s a safe bet that government expenditure estimates will be greatly exceeded, and [this] rising debt will cause the price of gold to rise to $10,000…over the next five years. (Let me explain further.] Words: 1767
Bubbles tend to follow the 80/20 ratio indicated in the Pareto Principle where approximately 80% of the price move occurs in the LAST 20% of the time. That being the case it would appear that gold and silver could conceivably top out around $9,000 per troy ounce and $250/ozt respectively .This is not a prediction of future prices of gold and silver; it is an indication of what could happen in a speculative bubble environment based on the history of previous bubbles. Words: 1280; Charts: 1
Gold is operating on a smaller Contracting Fibonacci Spiral Cycle that is in synch with the larger Contracting Fibonacci Spiral the markets are in. Adding together the sum of parts… the price of gold will move up in price in 2013, 2016, 2018, 2019 and 2020, with each subsequent leg moving less in percentage terms than the prior move. Gold advanced 4 foldish from 1999 until 2008 ($252/ounce to $1046/ounce) suggesting that gold should top out below $4000/troy ounce by the end of January, 2013…[on its way] to $7,000 and $10,000 per troy ounce by 2020. [Let me explain.] Words: 834
The “Pareto principle” – it’s often referred to as the “80-20 rule” – states that 80% of the effects of something come from just 20% of the causes (that is that 80% of people control 20% of the wealth, that 80% of sales come from 20% of your customers, etc.) and a new report by Erste Group, the Austrian investment bank, says this principle can be applied to bull markets as well, including the current bull market in gold, and following this line of thinking, you get an $8,300 price target for gold by the spring of 2015. Words: 285
Lately analyst after analyst (161 at last count) has been climbing on board the golden wagon with prognostications as to what the parabolic peak price for gold will eventually be. That being said, however, only 51 have been bold enough to include the year in which they think their peak price estimate will occur and they are listed below. Take a look at who is projecting what, by when and why. Words: 644
I hope so, at American Gold Refinery, we saw a rush of buyers when gold was headed below 1200 a few weeks back. I wonder if it does in fact hit 1700-1800 again the selling would start up again like last summer.
 liquidity (defined as the sum of the U.S. monetary base and the foreign holdings of U.S. Treasuries) and the price of gold per troy ounce. The current correlation suggests a gold price of $1,780 as illustrated by the chart below.
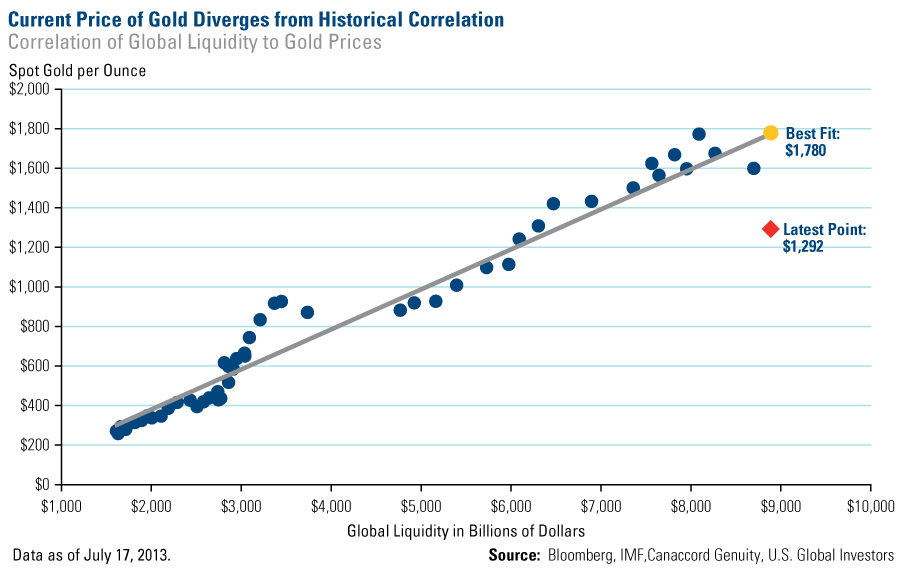 click to enlarge


I hope so, at American Gold Refinery, we saw a rush of buyers when gold was headed below 1200 a few weeks back. I wonder if it does in fact hit 1700-1800 again the selling would start up again like last summer.