Forecasts are only a guide or a potential road-map as no one can predict the future but we can assess risk, reward and probabilities. [Given that,] we think that the current probabilities favor a secondary bottom in gold stocks and that, very soon, the risk/reward dynamic will be heavily in favor of longs. [I explain and illustrate my conclusions below.] Words: 484; Charts: 2; Tables: 1
So says Jordan Roy-Byrne, CMT (www.thedailygold.com) in edited excerpts from his original article* entitled Secondary Bottom Coming in Gold Stocks.
Lorimer Wilson, editor of www.FinancialArticleSummariesToday.com (A site for sore eyes and inquisitive minds) and www.munKNEE.com (Your Key to Making Money!), may have further edited ([ ]), abridged (…) and/or reformatted (some sub-titles and bold/italics emphases) the article below for the sake of clarity and brevity to ensure a fast and easy read. The author’s views and conclusions are unaltered and no personal comments have been included to maintain the integrity of the original article. Please note that this paragraph must be included in any article re-posting to avoid copyright infringement.
Roy-Byrne goes on to say, in part:
Gold Stock Sentiment
Below is a sector sentiment indicator from sentimentrader.com (a combination of short interest and put-call ratios) showing that it can not get much worse for gold stocks (well, perhaps a bit).

Gold Stock Breadth
Breadth is a measurement of participation and the GDM chart below shows the number of stocks trading above their 200-day moving average at major bottoms and at secondary bottoms.

The chart above compares the current breadth to the breadth seen at the secondary bottoms in 2005 and 2009. Note that:
- at the major lows, breadth is usually at or near zero,
- at the secondary low in 2005, breadth was 41%. The market was in a stronger technical position then as the cyclical bear market was tame,
- at the secondary low in 2009, the breadth was 20%
- in 2002-2003 there was a triple bottom but, unlike the present, there was no major technical damage. At the third and final bottom breadth was 10%.
- at present, breadth is at 38%. It can fall to 20% and that would be in line with the most recent secondary bottom (following a major bottom).
The conclusion is that following a major bottom long-term breadth should remain healthy. It still is.
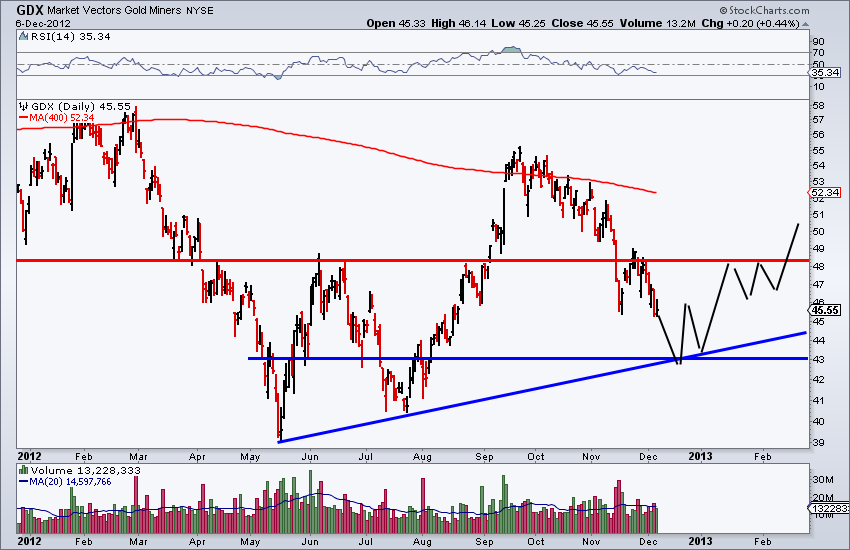
Course of Action
Below is a chart of GDX showing how this secondary bottom could play out. Currently, $43 is both lateral and trendline support.
Less than three weeks ago we wrote:
If we are indeed correct that the metals and shares will remain range bound then your task is simple. Prepare yourself for further consolidation by having your buy list ready and then be ready to act when the time comes. A wise friend once told me that in a bull market the goal is to accumulate positions at the lowest prices possible.
Conclusion
Rick Rule says that when investing in the resource sector you are either a contrarian or a victim. Consider the present sentiment and technical construct and it is difficult to ignore this emerging contrarian opportunity….The Fed is meeting next week and with gold stocks tanking into the meeting, it provides the setup for a bottom and rebound into January. Now is the time to be vigilant as the time to be a contrarian could be only days away.
Sign up HERE to receive munKNEE.com’s unique newsletter, Your Daily Intelligence Report
- FREE
- Contains the “best of the best” financial, economic and investment articles to be found
- Presented in an “edited excerpts” format to provide brevity & clarity to ensure a fast & easy read
- Don’t waste time searching for articles worth reading. We do it for you!
- Sign up HERE and begin receiving your newsletter starting tomorrow
* http://thedailygold.com/secondary-bottom-coming-in-gold-stocks/ (If you’d be interested in professional guidance in uncovering the producers and explorers poised for big gains then go here to learn more about our service.)
Related Articles:

What is developing in the markets is not the beginning of another leg down in gold, but a second chance to get positioned for what should be a very profitable intermediate degree rally over the next 2-3 months. [Let me explain further with a number of charts to support my position.] Words: 460
2. Goldrunner: HUI Index Could Go As High As 1000 in 2013! Here’s Why

The prospects look great for Gold and Silver to move sharply higher into 2013 to mimic the moves made in the 2005/ 2006 period and especially in 1979. In both cases back then the PM Stock Indices made big runs along with Gold and Silver. As such, the current HUI looks good for a major bottom to now be in place and to mimic the PM Stock Surrogate chart from the late 70’s. This would see the HUI go as high as the 1000 area in 2013. Let me explain further. Words: 640
3. We Are Certain Gold Producers Will Soar – Here’s Why
For the past eighteen months, gold stocks have been pummeled…What’s going to move these darn stocks? Will their day ever come? Could our research – gulp – be wrong? Jokes have even started circulating…[such as] a) What’s the difference between a seagull and a gold stock investor? The seagull can still make a deposit on a Mercedes. b) Gold equities may be bad, but I slept like a baby last night. I woke up every hour and cried. Laugh or cry, however, underneath this heap of stock-certificate debris is the contrarian opportunity of a lifetime. That’s a strong statement, I know, but below I present numerous well-researched reasons why I’m convinced gold stocks are one spark away from igniting the portfolios of those with the cash to buy, courage to act, and patience to hold. Words: 2800
4. What, Me Worry? Not When You Look at These Monthly Gold & Silver Charts

We’ve been surprised at the recent action in the precious metals complex. During the recent correction the shares were showing quite a bit more strength than the metals. Then the shares took a dive below support yet the metals maintained their recent lows! How do we interpret this wild volatility in the relationship between the shares and the metals? Quite often we look at daily and weekly charts. Now is the time to take a look at the monthly charts which can help us get a better read on the larger trends at hand. Words: 636
5. Relative Strength Favors Gold Miners vs. Physical Gold

The best way to look at miners, in relation to gold, is to look at the relative strength of each which is most clearly illustrated through ratio analysis. Whether you are a fundamental or technical analyst, both schools of thought support the notion of investing in sectors that exhibit positive relative strength. For those unfamiliar, the idea is that relative strength tends to persist over time and that it is often best to invest in securities that exhibit positive relative strength. [So what does relative strength analysis suggest is the appropriate course of action these days? Let’s take a look.] Words: 805

Hedge fund manager Hugh Hendry has stated, “There is no rationale for owning gold mining equities. It is as close as you get to insanity. The risk premium goes up when the gold price goes up.” Indeed, the notion that adding gold and other commodities to one’s portfolio produces a higher expected return with lower risk failure has failed of late and can be illustrated through the following charts. Words: 808
7. Which Is the Best Buy Now – Gold or Gold Stocks?

You have probably read in multiple articles that mining stocks offer leverage to the movement of the underlying metal. This hasn’t been the case over the past several years, however, which has created some confusion in the precious metals investment community. While the gold price has more than doubled (+110%) in the past five years, the AMEX Gold Bugs Index (HUI) is up only 15% so why do people keep saying that mining stocks offer leverage? Well, because they do during certain periods of the bull market. [Let me explain the situation more fully and exactly where we are in the current bull market.] Words: 677