By using a highly unreliable measure like the U.S. dollar, our ability to make proper economic decisions is severely impaired…[because] we…are not easily able to distinguish between what is a real increase or decrease…Due to its monetary properties, however, gold can be used to measure wealth across generations. [This article looks at U.S. GDP, the federal minimum wage, the average hourly wage and the adjusted monetary base in terms of the price of gold over time. It reveals what the situation really looks like – and it is not a pretty sight.]
The commentary above & below are edited excerpts from an article (see original article* HERE) by Hubert Moolman (hubertmoolman.wordpress.com/)
U.S. GDP in U.S. Dollars
When you look at the chart below of U.S. GDP in U.S. dollars it tells you that the U.S. economy has been growing almost consistently…
It also tells you that the U.S. economy is about eight times bigger than it was in 1947.
U.S. GDP In Gold Terms
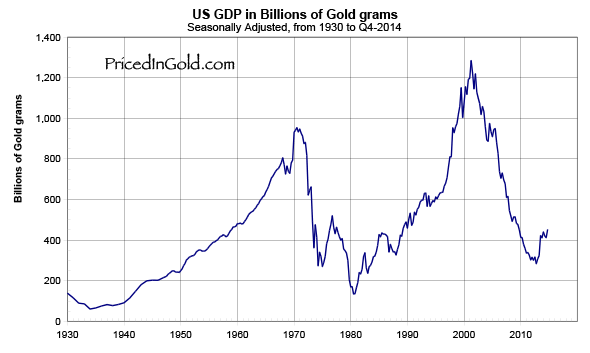
GDP in gold terms (GDP as measured in billions of gold grams (from PricedinGold.com)…[as shown below shows a completely different picture] – that GDP…[has been] in a massive downward trend since 2001.
It also tells you that the U.S. economy is only about twice the size that it was in 1947…
Federal Minimum Wage & Average Hourly Wage In Gold Terms
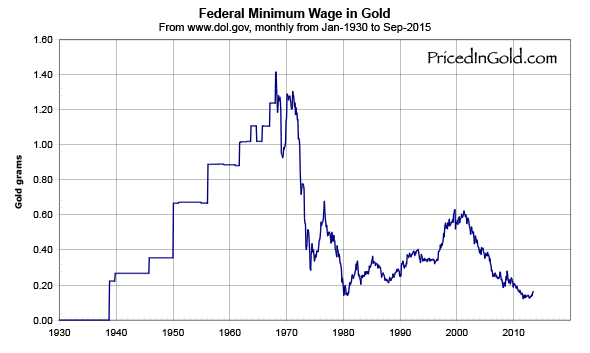
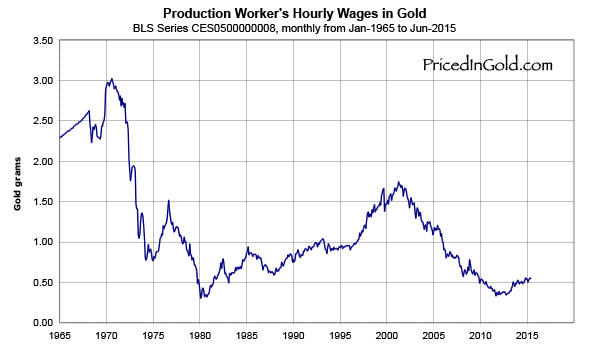
…When you look at any chart of U.S. wages in dollars, it shows that wages are consistently going up, and are multiples higher of levels 60 or more years ago [but, measured in gold terms, tells a completely different story as the] two wage charts below so clearly show (again from PricedinGold.com):
The above two charts…[clearly show that] wages are almost at the lowest they have been over the last 70 years.
Adjusted Monetary Base in Gold Terms
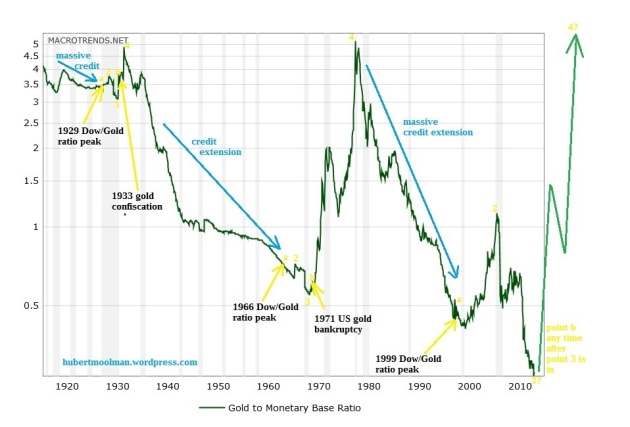
…The chart below (from macrotrends.com) shows the ratio of the gold price to the St. Louis Adjusted Monetary Base [going] back to 1918; that is the gold price in U.S. dollars divided by the St. Louis Adjusted Monetary Base in billions of U.S. dollars.
[The above is] essentially a measure of the gold price relative to the U.S. currency in existence [and] this ratio is at an all-time low (extreme). [Interestingly, each] time the ratio reached an all-time low, based upon the patterns indicated (see point 3 in 1970 and 1932), we had a change in the monetary order…Will the system continue…, or will confidence in it forever be lost? Will the perpetrators live another day to continue their debt-based monetary system?
The above article has been edited by Lorimer Wilson, editor of munKNEE.com (Your Key to Making Money!) and the FREE Market Intelligence Report newsletter (see sample here – register here) for the sake of clarity ([ ]) and brevity (…) to provide a fast and easy read.
*https://hubertmoolman.wordpress.com/2015/10/13/gold-price-forecast-gold-signals-the-end-of-this-monetary-era/
 munKNEE.com Your Key to Making Money


