 [Many people assumed that with Donald Trump winning the election that gold]…would rocket beyond $1400 [yet gold] has actually…DROPPED since the election. With gold experts and analysts scratching their heads, we offer our opinion on what is going on with gold and how gold investors should position themselves moving forward.
The comments above and below are excerpts from an article by Hebba Investments (HebbaInvestments.com) which may have been enhanced – edited ([ ]) and abridged (…) – by munKNEE.com (Your Key to Making Money!)
to provide you with a faster & easier read. Register to receive our bi-weekly Market Intelligence Report newsletter (see sample here , sign up in top right hand corner.)
Why Have Stocks and the US Dollar Risen But Gold Has Dropped?
The reason for the opposite moves to what was originally predicted in stocks, gold, and the US Dollar, was that much of the initial reaction was completely emotional due to the surprise uncertainty but then, when investors took a step back, they realized that Trump’s plan to spend massive amounts on infrastructure and his major plans for deregulation were good for stocks and commodities. In such a growth environment, it is better to own risk-on assets and stocks rather than gold – and we agree…[that] rising revenues mean increasing asset values while, with gold, you’ll only end up owning exactly the chunk of gold that you bought.
This is actually evidenced in history. In Roy Jastram’s excellent book The Golden Constant, he analyzes hundreds of years of the gold price versus commodity pricing (remember for most of economic history gold was money and thus had no “price” other than commodity ratios) and found that gold did well during economic recessions and depressions, while it underperformed commodities during economic booms. Essentially, you wanted to own gold (i.e. cash) during rough times and commodities during booms – pretty logical. If that is indeed the case then it truly is time to sell gold for commodities and stocks.
(Additionally, the Republican sweep of both sides of Congress meant that there was a good chance all of these policies would be implemented – after all this is the first time in quite a while that the White House and Congress were held by one party.)
Based on just the above facts it would make sense to sell gold – but there is one issue that makes Jastram’s analysis not quite accurate for today’s world…the bond market.
How Is the Bond Market Going to React & Fund Trump’s Infrastructure Plans?
Unlike the centuries of data that Mr. Jastram studied, our bond market is an artifice in central bank suppression of the natural interest rate. It is the only world where European 10-year bonds can offer negative yields and Japan can raise money over 30 years at 0.5%. This is starting to change, though, and after Trump’s election, bonds have been going vertical.
Look at the chart for US 30-year treasuries below. That is a scary thing for investors holding multi-billion-dollar treasury portfolios (think central banks and large mutual funds), and those are big paper losses that will be realized when bonds are sold – and will only increase as yields rise.
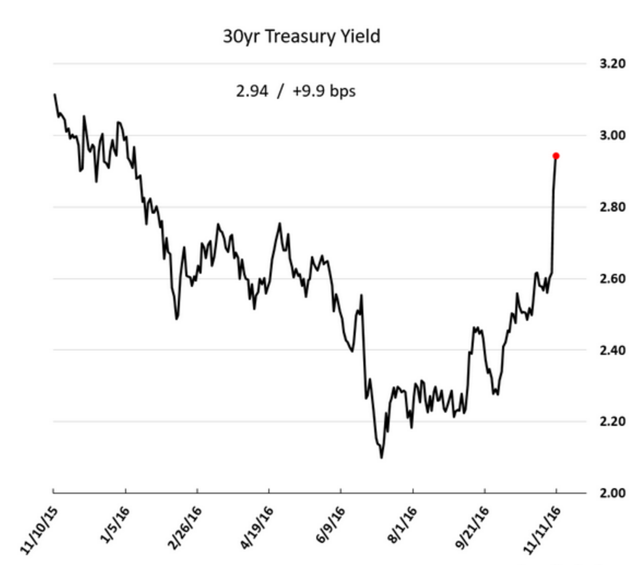
In one week, bond investors have already seen $1 trillion in losses – we highly doubt those investors will be buying more treasuries in a rising-yield, inflationary environment.
[The above brings us back to the initially mentioned]…economically optimistic view of markets based on the massive infrastructure plan Mr. Trump proposes to implement – how are bond markets going to react and fund that plan?
While details are still very few and far between on Mr. Trump’s spending plans, what we do know is that he plans on significantly increasing the budget deficit through spending and tax cuts…[That begs the question as to] how such a plan will be beneficial for stocks when it is projected to blow out deficits by so much that many Republicans are hesitant to back them. [The response is a “What, me worry? attitude] and that is exactly what we think is happening in stock markets which are trading to the upside on expecting big infrastructure spending and lower taxes…
This line of thinking has worked for the first few days after the election based on the initial emotional charge of the election results, but we don’t see how a collapsing bond market with rising yields will be good for stocks and the US Dollar.
Why It Would Be Good for Gold
Summing it all up we see a number of reasons why this environment is very negative for markets:
- Rising bond yields will cause chaos in a bond market that even Goldman Sachs warns are extremely fragile to rising rates.
- Trump’s plans call for massive fiscal spending, deregulation, and cuts to taxes that all will increase the US budget deficit and long-term debt and put more upward pressure on bond yields.
- Rising yields also mean the required rate of return for stocks (used in DCF analysis) will rise, which are negative for stocks.
- Rising rates also put a damper on real estate markets around the world as the cost of mortgage payments rise and lower prices buyers are willing to pay for real estate.
- Individuals, companies, and governments used to extremely low interest rates will now have a hard time raising money or will be forced to pay higher rates thus lowering investment
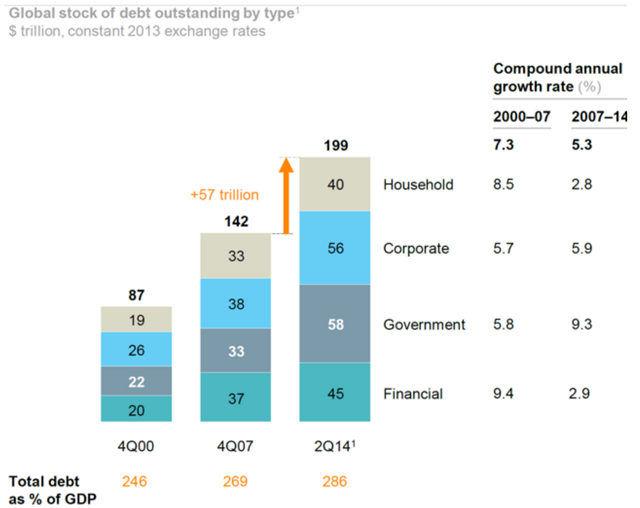
All of these things start with central banks losing control of bond yields and those yields starting to rise to more natural levels – and that’s what we think is happening. To strengthen our argument further we remind investors about this chart from the McKinsey Global institute showing where bond markets stand in terms of debt outstanding.
What do you think? Have your say in the Comment Section below.