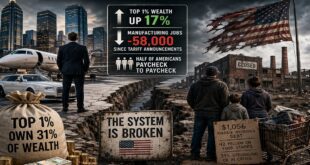
Households in 2013 that reveals that 52% of the respondents to the survey said they did not have a mere $400 in savings for an unexpected emergency. That suggests to me that over half the county is on a paycheck-to-paycheck struggle. Below are my key findings from the survey presented in a concise easy to understand format.
The following article is presented courtesy of Lorimer Wilson, editor of www.munKNEE.com (Your Key to Making Money!), and www.FinancialArticleSummariesToday.com (A site for sore eyes and inquisitive minds) and has been edited, abridged and/or reformatted (some sub-titles and bold/italics emphases) for the sake of clarity and brevity to ensure a fast and easy read. This paragraph must be included in any article re-posting to avoid copyright infringement.
- FINANCIAL WELL-BEING
- 60% of respondents reported that their families were either “doing okay” or “living comfortably” financially [broken down as follows:]
- 34% said their situations were about the same, and
- 30% said they were somewhat or much better off
- 34% said they were somewhat worse off or much worse off financially than before the 2008 recession [broken down as follows:]
- 25% said that they were “just getting by” financially and another
- 13% said they were struggling to do so
- LIFESTYLE CHANGES DUE TO RECESSION
- 42% said they had delayed a major purchase or expense directly due to the recession, and
- 18% said they had put off what they considered to be a major life decision
- SAVINGS
- 50% said they were putting some portion of their income away in savings, although
- 20% said they were spending more than they earned
- INCOME GROWTH
- 61% said they expected their income to stay the same in the next 12 months, while
- 21% expected their income to increase and
- 16% expected their income to decline
Renters
- The most common reasons cited by renters for renting rather than owning a home were:
- an inability to afford the necessary down payment (45%) and
- an inability to qualify for a mortgage (29%)
- 10% of renters reported that they were currently looking to buy a home
Credit experiences and expectations
- 31% said they had applied for some type of credit in the prior 12 months
- 33% of those who applied for credit were turned down or given less credit than they applied for
- 19% said they had put off applying for some type of credit because they thought they would be turned down
- Just over 50% were confident in their ability to obtain a mortgage, were they to apply
- Experience with credit appears to vary by race and ethnicity, with non-Hispanic blacks and Hispanics disproportionately likely to report being denied credit, to put off applying for credit, and to express a lack of confidence about successfully applying for a mortgage, though these effects are partially explained by other factors correlated with race/ethnicity and credit, such as education
Financing of education
- 24% said they had education debt of some kind, with
- 16% having acquired debt for their own education,
- 54% of those who failed to complete the program they borrowed money for reported having to cut back on spending to make their student loan payments (versus 39% for those who completed) and
- ) 56% believed that the costs of the education outweighed any financial benefits they received from the education (versus 38 percent for those who completed)
- 7% for their spouse/partner’s education, and
- 6% for their child’s education
- 16% having acquired debt for their own education,
Savings
- 57% of those who had savings prior to 2008 reported using up some or all of their savings in the Great Recession and its aftermath
- 48% said they could completely cover a hypothetical emergency expense costing $400 without selling something or borrowing money [that is, 52% could not]
It’s interesting that when reporting the extent of their financial well-being (see above), 60% said they were doing OK or better , yet when reporting the extent of their savings 52% said they did not have a mere $400 in savings for an unexpected emergency. That suggests to me that over half the county is on a paycheck-to-paycheck struggle.
Retirement
- Almost 50% said had not planned financially for retirement, with
- 24% said they had given it only a little thought and
- 25% said they had done no planning at all
- 31% said they had no retirement savings or pension (including 19% of those ages 55 to 64)
- 25% said they didn’t know how they would pay their expenses in retirement
- Among those ages 55 to 64 who had not yet retired, only
- 18% planned to follow the traditional retirement model of working full time until a set date and then stop working altogether, while
- 24% expected to keep working as long as possible,
- 18% expected to retire and then work a part-time job, and
- 9% expected to retire and then become self-employed
- 40% of those 45 and over who had not yet retired said the Great Recession had caused them to push back their planned date of retirement
- 15% of those who had retired since 2008 reported that they retired earlier than planned due to the recession, while only 4% had retired later than expected
Medical expenses
- 34% said they had gone without some form of medical care in the prior 12 months because they could not afford it
- 24% said they had experienced what they described as a major unexpected medical expense that they had to pay out of pocket in the prior 12 months
- 43% said they could not afford to pay for a major medical expense out of pocket, and
- 34% said it was only somewhat likely that they could afford to pay
[A great deal of insightful information on the current financial condition of Americans as a result of The Great Depression of 2008 can be found in the above survey results. What most stands out for me, however, is that when reporting their financial situation (see above),] 60% of respondents reported that they were doing OK or better (see Financial Well-being), but when reporting the extent of their savings (see Savings) 52% said they did not have a mere $400 in savings for an unexpected emergency. That suggests to me that over half the county is on a paycheck-to-paycheck struggle.
Editor’s Note: The author’s views and conclusions in the above article are unaltered and no personal comments have been included to maintain the integrity of the original post. Furthermore, the views, conclusions and any recommendations offered in this article are not to be construed as an endorsement of such by the editor.
*http://globaleconomicanalysis.blogspot.com/2014/08/fed-study-finds-2-million-in-forced.html#BgRZIVi3753eEHpf.99
Follow the munKNEE!
- Register for our Newsletter (sample here)
- Find us on Facebook
- Follow us on Twitter (#munknee)
Related Articles:
1. Majority of Americans In Dire Economic Shape – Here Are The Facts
We live in a country where almost everyone is drowning in debt and where most people are either flat broke or very close to flat broke…The following are 21 ways to end the phrase “Americans are so broke”. Read More »
2. Resurgence of Subprime Auto Debt Spells T-R-O-U-B-L-E
During the credit crisis, one of the problems that occurred was that too many loans were being made to people that had no ability of paying their debt back. We see this trend in full stride once again in the auto industry. Subprime auto lending is back in a big way. Why is this happening? What are its repercussions? This article explains. Read More »
3. Average American Can’t Afford To Own A House – Here’s Why
Regular home buyers are wondering why they are unable to partake in the American Dream of owning a home now that they actually have to document their income and put some skin in the game. The reason is that the current median selling price of $201,000 puts real estate out of reach for most Americans earning the typical $50,000 a year unless they go into massive levels of debt. They are too broke to own a home! Read More »
4. What Happened to America’s “Middle” Class? Here’s What!
Most American households are making less money than they would have 14 years ago with adjusted dollars. It begs the question, what is happening with America’s middle class? Why is there a decline? Read More »
5. Never Have SO Few Owned SO Much – Where Do You Place in the Wealth Hierarchy?
How much does the typical American family make? This question is probably one of the most central in figuring out how we can go about fixing our current economic malaise. In this article we break down the U.S. household income numbers. Words: 464 Read More »
8. How the Poor, Middle Class and Rich Spend Their Money
How do Americans spend their money and how do budgets change across the income spectrum? The graph below answers these questions. Words: 240 Read More »
Visit wsj.com – HERE – to find their calculator which shows where your household income stands compared to others in the U.S.. $506,000 puts you in the top 1%; the much talked about $250,00 in the top 6%; $200,000 in the top 10% while an annual salary of $43,000 puts you in the top/bottom 50%. Where do you stand? Read More »
10. The Average Home “Owner” Is Totally Out of Touch With Reality! Here’s Why
A recent Gallup survey on expected future returns of asset prices shows that most Americans still think that owning a home is the best way to generate a high return in the future. Nothing could be further from the truth! It just shows how totally out of touch with reality the average American is. Read More »
11. Your House: A Home, An Investment or a Ponzi Scheme?
In the past few decades, the concept of home ownership has been completely turned on its head. Previously, homes were considered a very long-term consumption good…[No one] ever considered tripling the value of their homes by retirement time and selling them to move beachside yet, somehow along the way, this became a reasonable investment expectation. Even today, home buyers still make their purchases with the hopes of escalating prices. [It begs answers to these questions: Is a house just a home? Should a house be expected to behave like an investment? Is the housing game nothing more than a Ponzi scheme where the end buyer before the market corrects becomes the “greater fool”? Let’s try and answer those questions.] Words: 935 Read More »