 determining risk – sentiment, breadth, valuation and market liquidity – thus things are cued up for a substantial pullback. This article takes a look at each of the aforementioned risk factors and explains what each is currently conveying.
Lamensdorf goes on to say in further edited excerpts:
Here’s a look at each of the aforementioned 4 risk factors.
1. Sentiment
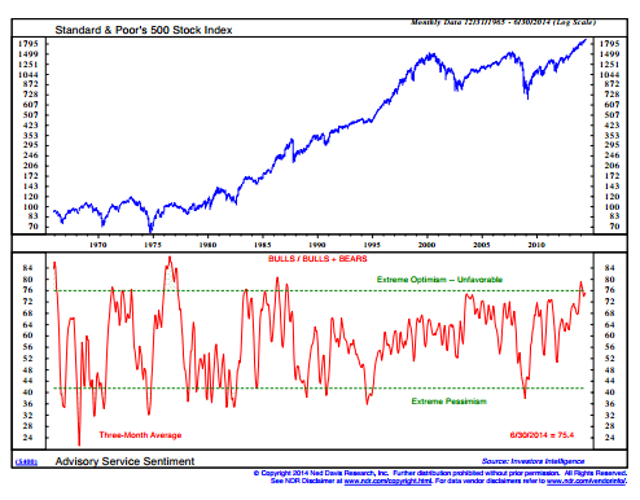
The infamous Investor’s Intelligence bulls/ bulls + bears indicator includes data from Investor’s Intelligence-Chart Craft. Marty Zweig, a well-known market participant who is now deceased, tweaked the gauge. The current reading is at a 17 year high, which is a level not seen since the summer before the crash of 1987.
click all charts to enlarge
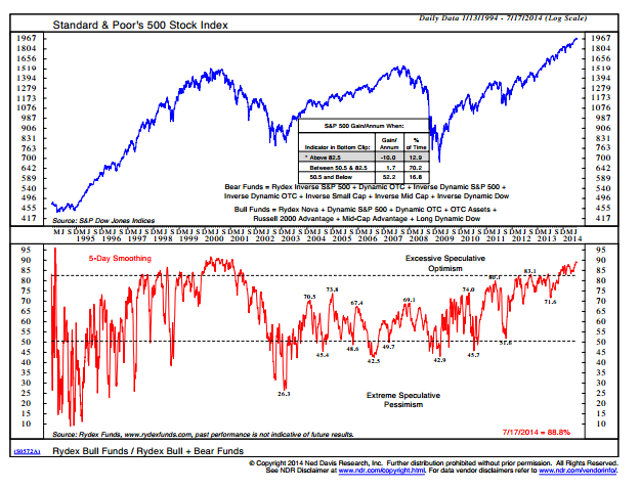
Excessive speculation is also present within the Rydex family of funds. Take note of the lower window portion of this chart, which displays the Rydex Bull Funds/Rydex Bull + Bear funds. Such an optimistic skew has not been since the top of 2000.
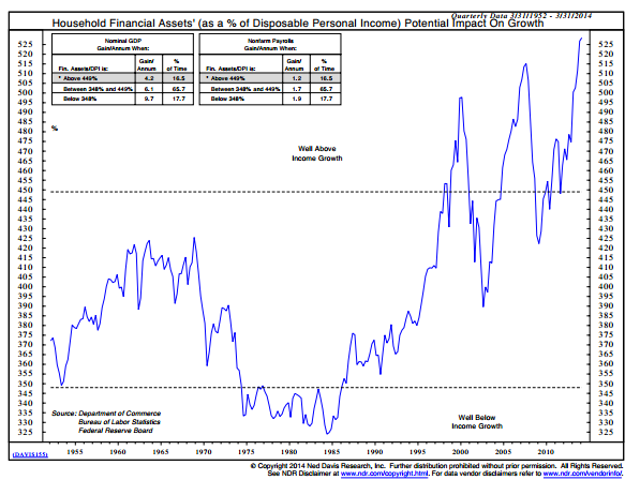
Households own more financial assets now than they have at any other period. Media outlets have been reporting that individuals, for the most part, have been uninvolved in the recent bull market. However this chart, which utilizes data provided by the Federal Reserve, repudiates these claims. Such heavy involvement in financial assets indicates that investors are being overly aggressive and far too optimistic.
2. Breadth
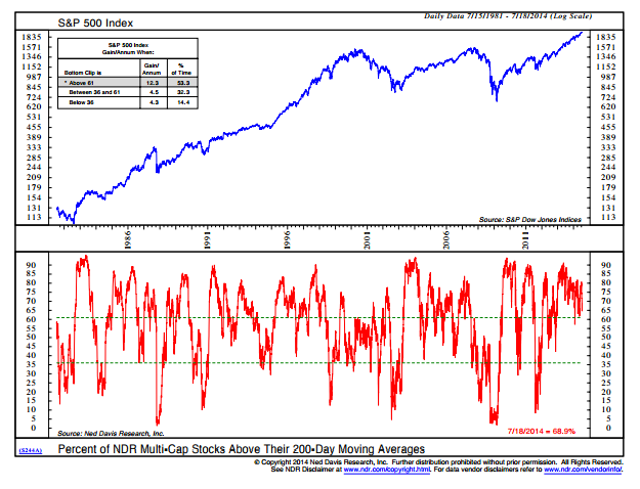
Tracking stocks above their 200-day moving averages is useful in determining whether the market is overbought or oversold. It can also reveal periods of poor breadth. Last year this gauge hit 90, which is extremely overbought. It has continued to hit a series of lower highs while the indexes have continued to hit higher highs. Thus, a negative divergence has been formed.
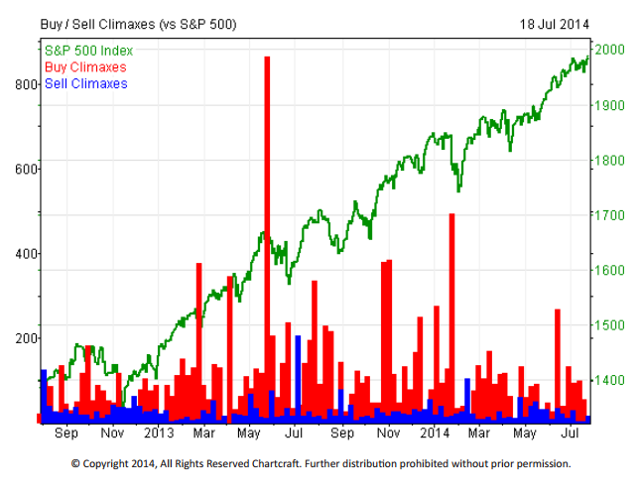
- Buying climaxes occur when a stock makes a 12-month high yet closes the week with a loss. They are a sign of distribution and indicate that stocks are moving from strong hands to weak ones.
- Selling climaxes occur when a stock makes a new 12-month low but then closes the week with a gain. They are a sign of accumulation, and indicate that stocks are passing from weak hands to strong ones.
- Traditionally, when markets have bottomed a large number of selling climaxes occur (shown in blue).
- Inversely, a large number of buying climaxes (shown in red) indicates distribution.
- While we have had several mini corrections within the last year, none of them have produced a sufficient number of selling climaxes to produce a significant bottom.
- Over the last year and a half, there have been half a dozen buying climaxes that have reached over 300. This implies that stocks are being sold into rallies, which creates poor breadth characteristics in the marketplace.
3. Valuation
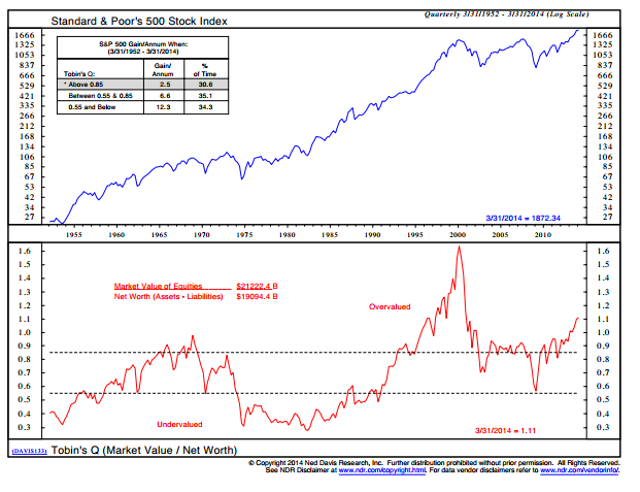
Tobin’s Q measures replacement value of market assets relative to their stock price. The market is currently experiencing the second highest valuation within the last 60 years, proving that investors are overpaying for stocks.
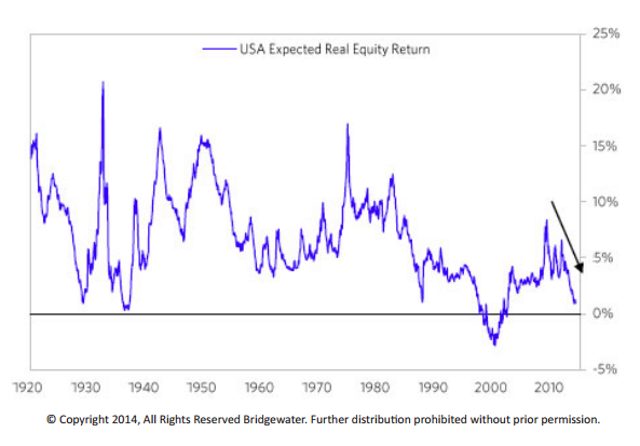
The USA Expected Real Equity Return, published jointly by Bridgewater and the University of Texas and released to the public, judges the forward expected return of the stock market and the gauge is at 1%, which is the second lowest reading over the last 50 years.
4. Market Liquidity
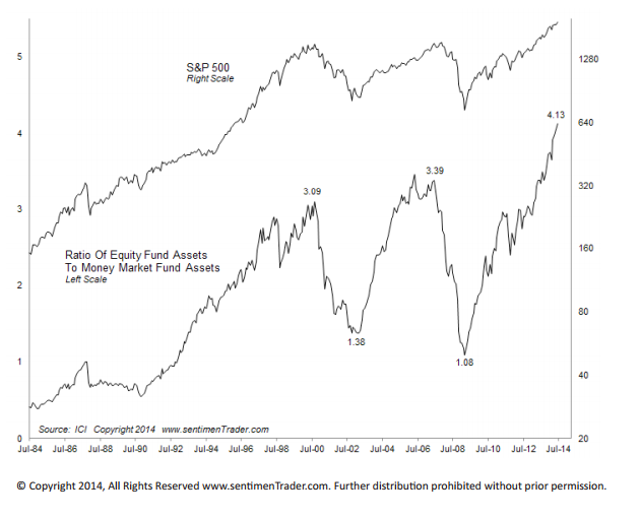
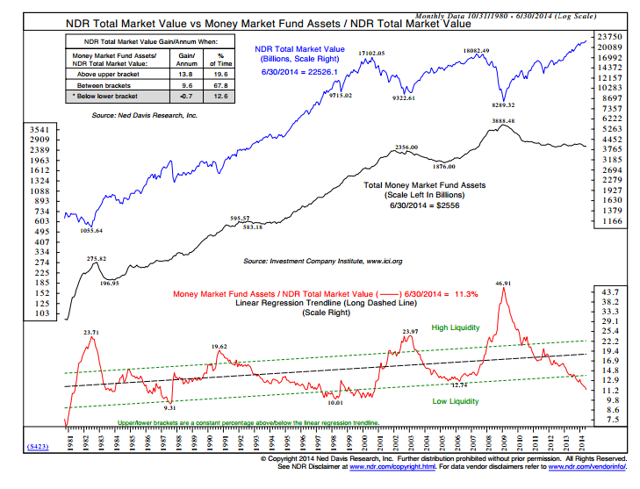
As of April, there was $4.13 invested in stocks for every $1 stored in money markets. This is one of the worst ratios in history, and it shows that tremendous liquidity has been used up to produce the current stock market rally. With the tank so empty, can this rally be maintained?
The NDR chart below bolsters the previous indicator produced by sentimenTrader.com. As one can see, the ratio is at its lowest point in 10 years.
Conclusion
When taking a step back and viewing longer-term gauges, we see warning signs flashing. Many of these readings are in extreme territories, and historically bear markets have occurred from such overbought positioning. We are all cued up for a bear!
Editor’s Note: The author’s views and conclusions in the above article are unaltered and no personal comments have been included to maintain the integrity of the original post. Furthermore, the views, conclusions and any recommendations offered in this article are not to be construed as an endorsement of such by the editor.
*http://seekingalpha.com/article/2445045-market-timing-report-indicators-are-cued-up-for-a-bear-market?ifp=0 (© 2014 Seeking Alpha)
If you liked this article then “Follow the munKNEE” & get each new post via
- Our Newsletter (sample here)
- Twitter (#munknee)
 munKNEE.com Your Key to Making Money
