When it comes to the future of oil, there is much speculation, but little hard analysis. You have the official line from the IEA that has oil prices stopping their abrupt rise and creeping up at a comfortable pace for the next 25 years. You have peak oilers shouting that we’ve run out of oil and the end is near. [Let’s take an indepth] look at the various models and forecasts [and determine] what is logical, what is wild speculation, and what you should expect for oil prices in the coming years. Words: 1410
So says Shane Lofgren (www.bridgetownfinancialgroup.com) in his original article* as posted recently at www.seekingalpha.com which Lorimer Wilson, editor of www.munKNEE.com (Your Key to Making Money!), has further edited below for length and clarity – see Editor’s Note below. (This paragraph must be included in any article re-posting to avoid copyright infringement.)
Lofgren goes on to say, in part:
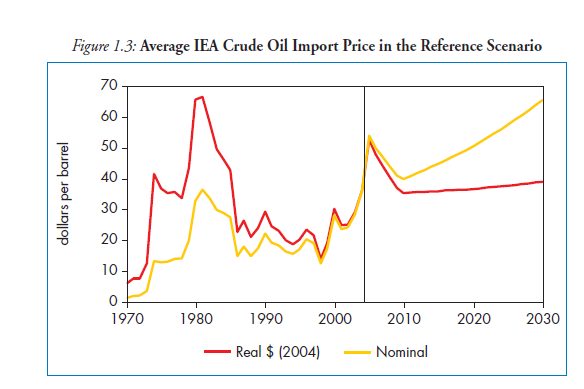
IEA Projections:
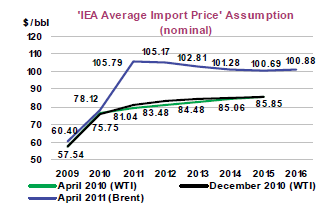
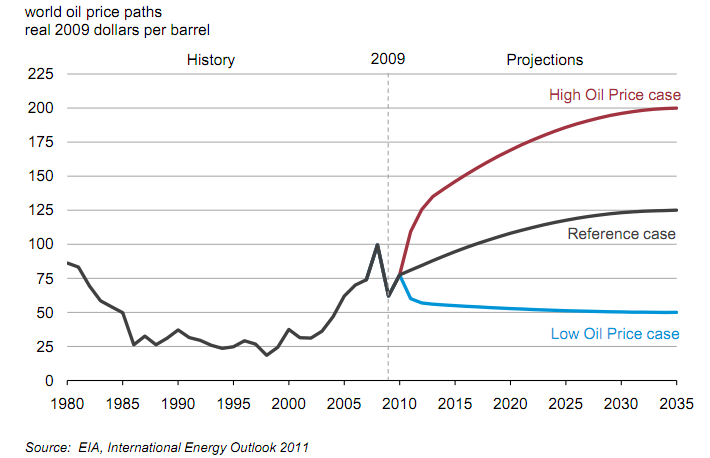
As you can see [from the above charts], each shows prices inching up and then eventually leveling off. I could not find any methodology for their price forecast [which] is an interesting absence given that they have a very complicated model with well documented methodologies that they use for all of their other forecasts…
In the IEA model, oil prices and GDP are taken as exogenous values, meaning that they are not the result of their complex model. GDP numbers are taken from the IMF, OECD, and others. Oil prices are not accounted for. This makes me wonder if price estimation isn’t the focus of their efforts, and if they don’t simply use a basic trend growth projection based on a very long cycle, or some modified Hotelling’s rule, where they grow the prices by the interest rate. I bring this up because I tend not to trust forecasts that don’t have satisfying explanations [albeit] you don’t have to know the workings of a model for it to be useful…
EIA Projections:
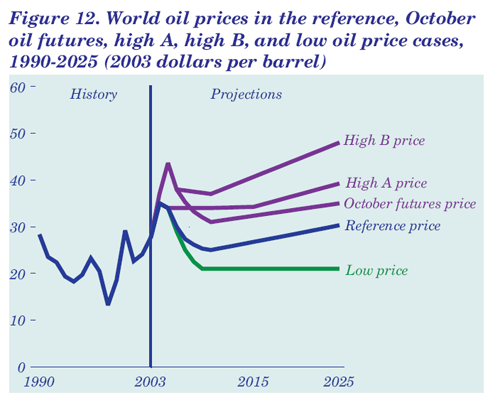
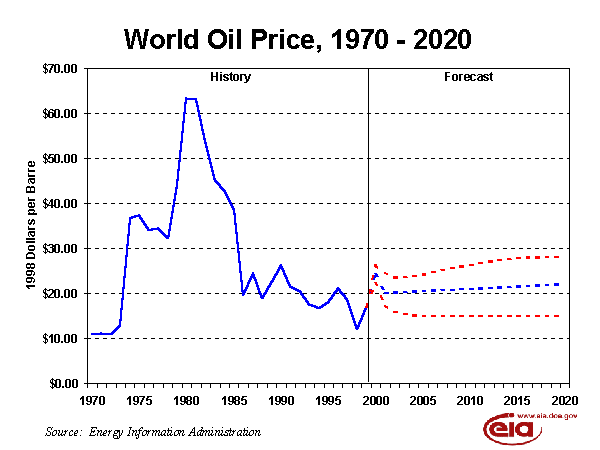
The above slides show that the EIA has consistently forecasted slow steady growth, or reversion to the mean. This strikes me as a “broken clock method.” It’s like someone asking what time it is and always saying it’s the same time. You’ll be right sometimes, but I bet there are better ways to determine the time, like looking at the sky or the length of shadows. As you would expect, the EIA method of predicting slow and steady growth in prices has been a significant failure. Indeed, you can view this .pdf which shows every EIA prediction since the 80s.
In the 80s, they missed the price drop as supply started to outpace demand; in the 90s they did fairly well, but I’d attribute that to being lucky that supply and demand were fairly well in balance, and when demand growth started to outpace supply growth, they were flat wrong again. The mean % error since 2000 has been between 23% and 54%. Basically, they’ve done about as well as you would expect given that their methodology seems to be to always pick the current price and grow it very slowly.
The IEA seems to be using the same method, though I can’t speak with certainty. I couldn’t find any published methodology or forecast history evaluation like with the EIA, but the following slides give you an idea that they are little better than the EIA.
IMF Projections:
In the IMF World Economic Outlook, April 2011, they lay out a different model for forecasting prices. This model is straight from undergrad economics, but it has the attractive quality of being explained and of being able to show strong growth or decline in prices, based on changes in supply and demand. In a nutshell, they determine demand growth by looking at economic growth and how much that growth should translate into a growth in demand at stable prices. Then they extrapolate supply growth forward based on the trends of the past decade. They look at how the growth in stable price demand will be greater than growth in supply, and then look at how much prices would have to increase to bring demand and supply into balance. Note that this is not a peak oil model. Any level of supply growth or decline fits. If anything, it is a “business as usual model,” as it uses econometric analysis to look at past trends and past tendencies and then simply assumes that they will continue in the future.
Who in the world is currently reading this article along with you? Click here
Mathematically, the model is: price change over a period = (Growth * income elasticity of demand – base supply growth)/(price elasticity of demand + price elasticity of supply). They use .68 for income elasticity of demand (IED), 0 for price elasticity of supply (PES), and .072 for long term price elasticity of demand (PED). They list the methodology for determining these values, which was basically to use a panel regression approach on prior data.
Their caveats are that these elasticities will likely change in higher price environments, and that isn’t modeled. They also note that emerging markets tend to have significantly higher income elasticities of demand, since their growth is more energy intensive, and with the proportion of growth coming from EMs rising, that will put upward pressure on the IED. Finally, the notion that the income elasticity of supply would remain zero under ever larger increases in prices seems faulty. Eventually, firms earning more money will plow it back into greater investments and there will be a supply response in some places, like the liberalized U.S. market.
However, we can’t take such a response for granted. Other more highly regulated markets might have difficulty growing. Monopolies might be happy to just keep letting prices rise. Much oil is owned by governments, who would rather just use the extra revenue for staying in power rather than invest for their long term. This could explain the lack of a strong global supply response up to this point. And of course there is the usual peak oil explanation that the geology itself is becoming increasingly more difficult, which is a hard argument to dispute in its more moderate forms. All of these things hinder the growth of supply in higher price environments and thus prevent new supply from bringing prices back down.
We’ve seen the historical performance of the EIA and IEA methods and it would be useful to compare the IMF model to them. This will be difficult because the IMF never made real forecasts and our current model is based on information that was acquired after the fact. Still, when you create a model that is able to fit the data fairly well, then you can at least make the claim that you are edging toward a better understanding. If this model can capture the upward dynamics in prices that the EIA and IEA seemed to completely miss, then I feel like that would indicate some value in the model.
With this in mind, let’s do a rough, back of the napkin calculation using CIA World Factbook and Wolfram|Alpha numbers for 2001 – 2010. GDP in dollars increased 81.9%, while oil supply increased 14.6%. Using the IMF’s numbers, .68 as the IED, 0 as the PES, and .072 as the long term PED, you get (.819 * .68 – .146)/(.072 + 0) = 5.72, or a 572% predicted increase in the equilibrium price of oil over that period. The actual increase from year-end ’01 to ’10 was approximately $85/$20, or 450%.
The prediction is by no means perfect, but is far more accurate than the EIA’s guess from 2001, which was 26.05 or 30% growth. Again, this isn’t a completely fair comparison, but it shows that the IMF model is capable of predicting strong rises in prices when supply growth is constrained in a way that the EIA/IEA models don’t seem to be able to do…
The most recent IMF estimates for GDP growth over the next 2 years are ~ 3.6%. In their April 2011 WEO they forecast supply growth of 1.25%–.75% baseline growth and a .5% addition from OPEC’s slack capacity. Plugged in the model, we get (.036 *.68 – .0125)/.072 = 16.6% growth in prices per year. If we are looking at the Brent, which tends to be more reflective of global supply and demand conditions, then that would be $136 at year end 2012 and then $158 at year end 2013.
That sounds like a great deal, but it is not unthinkable, as prices grew at a faster rate than that from ’03 to ’08. Now, many assumptions from the model could prove wrong. GDP might come in below that, and again and there will likely be stronger price responses at higher prices, Still, this gives an impression of a much more serious potential increase in prices than the IEA has suggested…
* http://seekingalpha.com/article/363431-flawed-oil-forecasts-hide-continued-upward-pressure-on-prices
Editor’s Note: The above article has been has edited ([ ]), abridged (…) and reformatted (including the title, some sub-titles and bold/italics emphases) for the sake of clarity and brevity to ensure a fast and easy read. The article’s views and conclusions are unaltered and no personal comments have been included to maintain the integrity of the original article.
Why spend time surfing the internet looking for informative and well-written articles when we do it for you. We assess hundreds of articles every day, identify the best and then post edited excerpts of them to provide you with a fast and easy read. Sign-up for Automatic Receipt of Articles in your Inbox and follow us on
FACEBOOK | and/or
TWITTER so as not to miss any of the best financial articles on the internet.
Related Articles:
It wasn’t supposed to be this way. By now, Peak Oil was supposed to be a fact of daily life. People were supposed to be lined up at gas stations, struggling to buy US$10-a-gallon gas. Solar and wind companies were supposed to occupy prominent places on the Big Board instead of going out of business right and left. People were supposed to have diminished expectations – resigned to shivering in the dark. Free markets, a flawed system of commerce, were to be exposed as a misleading theoretical construct, incapable of providing for people’s needs…The world was running out of resources…Now, suddenly, there is a different tale to tell and the New York Times is up to the task. Up and down the Americas, we learn, there is an Oil Boom. Suddenly, we have gone from enforced austerity to an unheralded plenty. Middle East, watch out! [But all is not as it seems. Let me explain.] Words: 1440
2. Peak Oil Is Still With Us – Here’s Why
In a recent article called There Will Be Oil in the WSJ, Daniel Yergin once again attempts to debunk the concept of peak oil and sees global production capacity growing to 110 mmbpd by 2030, followed by slow decline. In this short report I take a quick look at his key arguments in an effort to bring further convergence between the peak oil and business-as-usual camps. [Unfortunately, I failed to do so concluding that Peak Oil is still very much with us. Let me explain.] Words: 2032
3. Why Oil is Headed To $300 – Yes, $300!
The price of oil is headed “unimaginably higher” in the next few years – to somewhere north of $300 a barrel – because of two very simple forces. Words: 708
4. U.S. Military Warns of Serious Oil Shortfall by 2015
The US military’s Joint Operating Environment report from the US Joint Forces Command has warned that surplus oil production capacity could disappear by 2012 and that there could be serious shortages by 2015 with a significant economic and political impact. Words: 455
5. Hess: $140 Oil was NOT an Aberration – It was a Warning!
Once economic growth recovers, it is likely we will return to the market conditions of 2008. The price of $140 per barrel oil was not an aberration; it was a warning. An oil crisis is coming that could prove devastating to future economic growth. Given the long lead times of 5-to-10 years from oil discovery to production, we need to act now to avert this outcome. Words: 862
6. New Discoveries Insufficient to Avoid Peak Oil
The imbalance between oil demand and supply is likely to result in a decade long upward trajectory in energy prices, marked by volatility. The world is going to be running short of oil production in the not too distant future and these new discoveries don’t change that reality. Words: 2032
 munKNEE.com Your Key to Making Money

