Who knows how long before the Dow Jones Index finally receives a well overdue  market enema, but I can assure you of this, when it arrives it will be a VERY messy occasion!
The above introductory comments are edited excerpts from an article* by Steve St. Angelo (srsroccoreport.com) entitled The Chart Every Silver Investor Should See.
St. Angelo goes on to say in further edited excerpts:
The clowns on the financial networks continue to be euphoric about the broader stock markets as they head toward the heavens. The Dow Jones Industrial Average hit a new ALL TIME HIGH reaching 17,265 today [Sept.19th,2014]. However, if we look at the chart below, we can see a troubling trend.
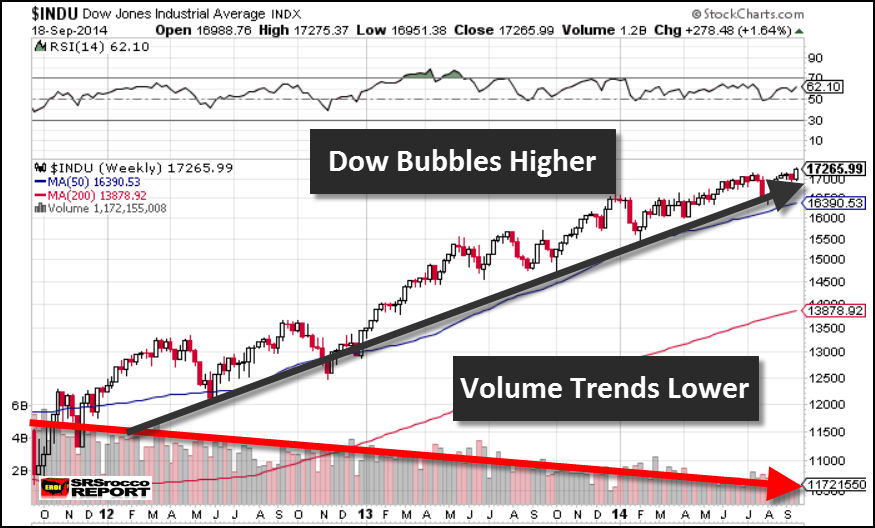
As the Dow Jones bubbles to new record territory, trading volume heads into the toilet. This is not a good sign. The Fed must be holding up the majority of the market as investors with any lick of sense, already bailed out of stocks long ago.
Editor’s Note: The author’s views and conclusions in the above article are unaltered and no personal comments have been included to maintain the integrity of the original post. Furthermore, the views, conclusions and any recommendations offered in this article are not to be construed as an endorsement of such by the editor.
*http://srsroccoreport.com/the-chart-every-silver-investor-should-see/the-chart-every-silver-investor-should-see/ (© 2014 SRSrocco Report. All rights reserved.)
If you liked this article then “Follow the munKNEE” & get each new post via
- Our Newsletter (sample here)
- Twitter (#munknee)
Related Articles:
1. This Weekend’s Financial Entertainment: “A Stock Market Crash IS Coming!”
Our financial system is in far worse shape than it was just prior to the financial crash of 2008. The truth is that we are right on schedule for the next great financial crash. You can choose to ignore the warnings if you would like but, ultimately, time will reveal who was right and who was wrong and, unfortunately, I think I will be proven to have been right. Read More »
2. Present Bull Rally In Stocks Dangerously “Beyond the Pale” – Here’s Why
It is frighteningly clear to any objective analyst and/or intelligent investor that the present bull market rally in stocks (2006-2014) is “beyond the pale” (outside the bounds of acceptable behavior) i.e. the excess valuation is dangerously above the market excesses of the 1920s. Read More »
3. We’re All Cued Up For A Bear! Here’s Why
When taking a step back and viewing longer-term gauges, we see warning signs flashing. Many of these readings are in extreme territories, and historically bear markets have occurred from such overbought positioning. We are all cued up for a bear! Read More »
4. SELL! U.S. Stock Market Is An Investor’s Nightmare – Here’s Why
The stock market is presently a roulette wheel with dimes on black and dynamite on red. We continue to have extreme concerns about the extent of potential market losses over the completion of the present market cycle. Read More »
5. Harry Dent: Get Into Cash – Stock Market Will Crash to 5,500-6,000 By 2017!
You have to get out of stocks. Stocks have bubbled again and when they go down they’re going to go down hard. Read More »
6. Coming Bear Market Could Turn Into A Historic Crash – Here’s Why
Amazingly, we are on the verge of a global deflationary downturn and what could be a historic bear market, yet Wall Street prognosticators remain focused on the inflationary risks of excessive monetary stimulus. Their focus could not be more wrong. Let me explain further. Read More »
If the past long-term cyclical correlations between interest rates, equities, and commodities were to play out as they have done going back to the 1880s, U.S. stocks and interest rates should continue to rise as commodities either fall or underperform according to a 60-year cyclical pattern model referred to as The Market Map. Read More »
8. It’s Just A Matter Of Time Before the Stock Market Bubble Is Pricked! Here’s Why
Once again the stock market is in full bubble mode. The market was already overvalued earlier this year and the froth continues to build. Valuations are off the chart and euphoria is setting in while, at the same time, you have inflation eroding the purchasing power of regular Americans not participating in this casino. All the signs of a bubble top are there – massive speculation, unexplainable valuations, and blind optimism – even though the fundamentals don’t make any sense. This article substantiates that contention. Read More »
9. These 6 Indicators Reveal A Great Deal About Market’s “Upside” Potential
Trying to predict markets more than a couple of days into the future is nothing more than a “wild ass guess” at best but, that being said, we can make some reasonable assumptions about potential outcomes based on our extensive analysis of these 6 specific price trend and momentum indicators. Read More »
10. What Does the 10-year Yield’s Death Cross Mean For Stocks?
The 10-year yield’s Death Cross has proven to be a pretty significant risk-off shot across the bow over the last decade and this matters today because the 10-year yield put in a Death Cross back in early April of this year. So what does the 10-Year’s Death Cross mean for stocks this time? Read More »
11. Financial Asset Values Hang In Mid-air Like Wile E. Coyote – Here’s Why
The financial markets are drastically over-capitalizing earnings and over-valuing all asset classes so, as the Fed and its central bank confederates around the world increasingly run out of excuses for extending the radical monetary experiments of the present era, even the gamblers will come to recognize who is really the Wile E Coyote in the piece. Then they will panic. Read More »
12. Look Out Below? Buffett Market Indicator Has Now Surpassed 2007 Level
Market Cap to GDP is a long-term valuation indicator that has become popular in recent years, thanks to Warren Buffett and it is now at the second highest level in the past 60 years – even surpassing the levels reached in 2007. Read More »
13. World’s Stock Markets Are Saying “Let’s Get Ready to Tumble!”
To ignore all the compelling charts and data below would be irresponsible and, as such, will NOT go unnoticed by institutional investors. Such bearish barometers for stocks worldwide will, unfortunately, be ignored by the ignorant and gullible hoi pollo causing them severe financial loss as investor complacency in the past has nearly always led to a stock market crash. Read More »
14. Stock Market Bubble to “POP” and Cause Global Depression
In their infinite wisdom the Fed thinks they have rescued the economy by inflating asset prices and creating a so called “wealth affect”. In reality they have created the conditions for the next Great Depression and now it’s just a matter of time…[until] the forces of regression collapse this parabolic structure. When they do it will drag the global economy into the next depression. Let me explain further. Read More »