You will read more and more articles touting how gold and silver have bottomed. 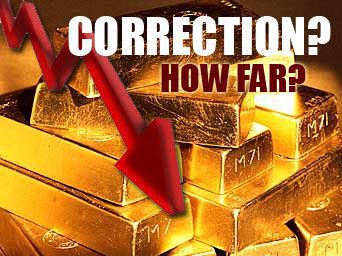 They have not, at least according to price behavior as determined by actual buyers and sellers in the market.
So writes Michael Noonan (edgetraderplus.com) in edited excerpts from his original article* entitled Gold And Silver – When[?] Precious Metals Bottom Is Irrelevant To Your Financial Health.
[The following article is presented by Lorimer Wilson, editor of www.munKNEE.com and the FREE Market Intelligence Report newsletter (sample here) and may have been edited ([ ]), abridged (…) and/or reformatted (some sub-titles and bold/italics emphases) for the sake of clarity and brevity to ensure a fast and easy read. This paragraph must be included in any article re-posting to avoid copyright infringement.]
Noonan goes on to say in further edited (and paraphrased in some instances) excerpts:
There is no evidence of a change in trend. That means gold can still go lower, possibly
move sideways, and have occasional rallies, a natural feature of all bear markets. Know
that it takes time to turn a trend around…At current low prices, opportunity is so ripe.
One has to suspend reliance on the natural order of supply and demand in the PMs, for now, until the unnatural forces of faux supply, pretend non-existent interest of demand by central bankers plays itself out.
Gold – Daily Chart
Rallies are a normal feature of any bear market, and it is possible gold may break through the immediate resistance area of 1,300, as we show on the daily chart below.

If you look at late June, when price declined under 1,300, there was a brief two-day rally that failed. Compare those two trading days then with the last seven now. Price is not reacting away from that resistance. We often state that the how of a price reaction, or lack of one, is the market’s way of telling us what is likely to happen. It appears that buyers are absorbing sellers defending 1,300, and it may give way, next week.
The two strongest volume days in July did not result in any downside follow through, and that, in itself, is a message. You will read more and more articles touting how gold and silver have bottomed. They have not, at least according to price behavior as determined by actual buyers and sellers in the market.
Gold – Weekly Chart

Silver – Weekly Chart
We can say with certainty that there has been greater buying than selling at the lows in
both metals, and that shows clearly in the silver weekly chart below. We do not know how much
is simply short-covering…and how much may be actual new longs being accumulated by smart money.

Silver – Daily Chart
The daily silver is similar to, but not as strong as, gold. Still, evidence is growing to expect some sort of rally but, until we see the how and the extent of any rally, there can be no change in the assessment that the trend remains down.

Conclusion
We have been urging our readers each and every week to buy physical gold and physical silver [and that] price is not the issue but having it is! Perhaps now you better understand why. In addition to buying either or both, we also continue to advocate holding it personally. If you do not hold it, you do not own it. Your financial health depends on it!
[Editor’s Note: The author’s views and conclusions in the above article are unaltered and no personal comments have been included to maintain the integrity of the original post. Furthermore, the views, conclusions and any recommendations offered in this article are not to be construed as an endorsement of such by the editor.]
*http://edgetraderplus.com/market-commentaries/gold-and-silver-when-precious-metals-bottom-is-irrelevant-to-your-financial-health
Related Articles:
1. These 8 Signs Suggest Silver Has Bottomed & Will Head Higher Soon
The waterfall decline…[in silver prices] has resulted in many silver investors herd-mentality-300×218 throwing in the towel and exiting their positions. However, this is herd mentality and every successful investor knows it is almost always a failing strategy. With sentiment near all-time lows and blood still running in the streets, I am doing the exact opposite and wading into the waters once again. [Below are 8 reasons why I think that silver has bottomed.] Words: 1570 Read More »
2. Noonan: Silver Charts Suggest This Could be the Bottom!
Charts speak the loudest…and they never lie…[because they are] the true record of all buy and sell decisions executed, coming from the most informed to the least informed. Most of the problems lie with those who form an opinion, and how they choose to impose it onto what any given chart “says.” My understanding of what the quarterly monthly, weekly and daily charts are conveying about the price action of silver is, simply,] “Silver stackers, these lower prices are a gift you should keep on taking. Stay tuned.” Read More »
3. Noonan: Charts Suggest Potential Support for Gold Down at $1,040 to $1,100

If you want to make rabbit stew, first, you have to catch the rabbit so hopefully, first, we’ll see some concrete signs that a bottom is in before the regurgitation of “Gold is going to $10,000!” starts showing up in a host of new articles pandering for attention. The best way is to decide for yourself…so let us go to the most reliable source, the market, and see what the prices of gold and silver have to say about what everyone else has been saying about them. People have been known to exaggerate, even lie in their “opinions,” but the market never does either. Read More »
4. Noonan: Charts Suggest NO Ending Price Action In Either Gold or Silver – Take a Look!
Not one Precious Metals guru has gotten anything right in the last 18 months. All have been calling for considerably higher prices. Over the past several months none called for sub-$1,300 gold and sub-$20 silver. Crystal balls do not work and never have. When it comes to markets, anything can happen [but the charts convey that] there is no apparent ending action suggesting a selling climax or even a cause for a reaction rally. Take a look. Read More »
5. Charts Provide Certainty – Not Opinion: Here’s What They Say About Gold & Silver

Charts provide certainty, for they are absolute and the final word at the end of day, week, month, etc. There can be no dispute over a bar’s high, low and close, plus the volume, for whatever the time period under consideration. There is a high degree of logic within them and, while there can be differences of opinion over their interpretation, establishing a fixed set of parameters can mitigate most any potential dispute. So just what are the charts saying about the current trend in gold and silver? Let’s take a look. Read More »
6. Gold & Silver Rules of Engagement: IF This Happens, THEN Do That – Here’s Why, Here’s How
Never go against the market. It does not matter what your beliefs are…It does not matter what the fundamentals are either. [What matters] is the TREND! Once you know the trend is up you need a game plan on how to participate from the buy side and when the trend is down, a plan ion how to participate from the short side. If there is no trend, then the odds are not favorable for either game plan.[So exactly what are the charts saying about the trend in gold and silver these days? Read on!] Read More »
7. Gold & Silver: Don’t Wait for the Bottom – “Average Down”. Here’s Why
You cannot control what others do, especially those in power. You can control what you do. Just keep buying, regardless of price, because if/when the price of gold and silver were to go lower, you may not be able to buy. If/when the price of gold and silver were to go higher, it may be at such an accelerated rate that any price in the past few years seem cheap. Words: 550 Read More »
The next chapter [in gold and silver] has yet to be written. One thing is likely to be certain, it will get uglier. The public will not be prepared for what could take a few more years to develop, and the potential for yet much lower prices for both gold and silver. Read More »
9. What the Charts Say About the Future Price Action of Gold & Silver
The monthly silver chart does not reflect what could be viewed as ending action for the decline. If/as price rallies, it may be more of a futures selling opportunity than a sign of recovery. As the structure stands, odds favor lower price attempts. Read More »
10. Gold & Silver: Go “Get” While the Getting is Good! Here’s Why
There will come a time, and based on current charts no one knows when, that prices for gold and silver will become prohibitive and/or governments will do what they can to inhibit (steal) ownership, maybe even making it criminal to own or use in transactions. [That being the case we advocate that you go “get”] physical gold and silver [while the getting is good], consistently and at any price. The point here is not to “make money,” but to preserve and/or create wealth. [Let me explain.] Read More »


I agree that the charts are painted by elephants who drop millions of ounces into the market during overnight low volume that trigger algos and everyone else to sell. In addition the CB’s have been leasing gold into the market for years. GATA has all the evidence.
I believe the practice of selling naked shorts (buying Gold with freshly printed paper money) is what is responsible for the current low prices of Gold. Too soon investors will wise up, probably due in part because other Countries Central Banks are now using their own paper USD to purchase Gold (and other PM’s), which will then lead to the value of the USD reversing its current upward trend!