You can produce consistent gains by rigorously buying and selling very volatile stocks by using the relative strength index. Let me explain.
By Lorimer Wilson, Managing Editor of munKNEE.com and a frequent contributor to it and other sites such as eResearch.com, USfinancePOST.com, Bitgrum.com and TalkMarkets.com.
What Is the Relative Strength Index?
The relative strength index or RSI as described by Investopedia is “A momentum indicator that measures the magnitude of recent price changes to evaluate overbought or oversold conditions in the price of a stock or other asset. The RSI is displayed as an oscillator (a line graph that moves between two extremes) and can have a reading from 0 to 100.”
Simply put:
- If the RSI indicator is showing a reading of 70 or higher (a conservative reading of a minimum of 65 is acceptable) it means the stock is in overbought territory and it’s now likely that a pullback is coming soon and, as such, it would be an ideal time to exit and wait for an opportunity to re-enter in the future.
- If the RSI is showing a reading of 30 or below it means the stock is now in oversold territory and could be considered undervalued and is due for a bounce higher and, as such, it would be a great time to enter into a position or add to an existing position. The number 30 should only be used as a gauge. Often times marijuana stocks, for example, won’t actually drop below 30 on the RSI so, any reading in the 30’s or even the low 40’s can still make for a great entry point.
Examples Of RSI Strategy Implementation
Below are examples of how this simple RSI strategy could have been successfully implemented this year trading Canadian Licensed Producer (LP) marijuana stocks as tracked in munKNEE’s Cannadian LP Stock Index.
Cronos (CRON):
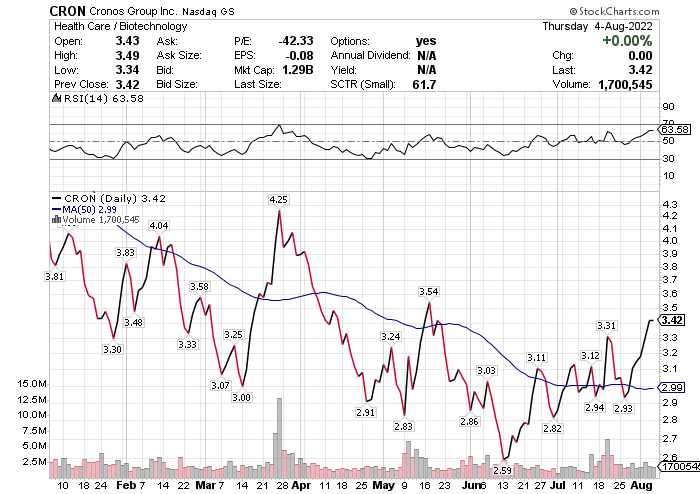
- Buy on January 27th (@ $3.30) when the RSI bottomed at an RSI of 30
- Sell on March 27th (@ $4.25) when the RSI approached 70 (or perhaps a more conservative 65)
- A profit of 29% was realized
- Buy on April 27th (@ $2.91) when the RSI bottomed at an RSI of 30
- Continue to hold as RSI has not yet reached a minimum RSI of 65.
Aurora Cannabis (ACB):
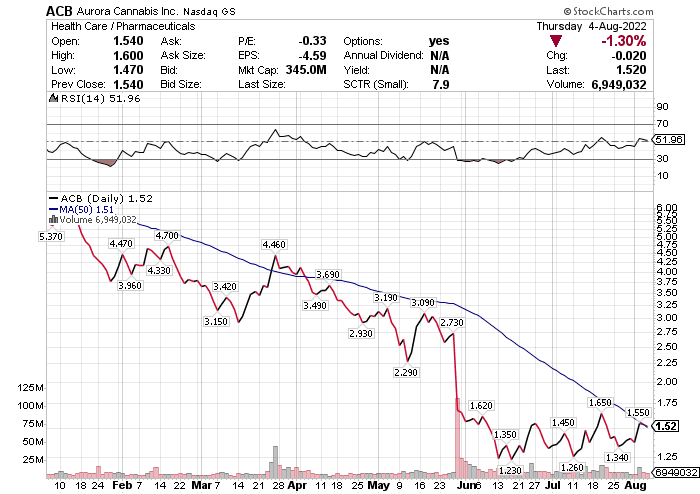
- Buy on January 27th (@ $3.96) when the RSI bottomed below an RSI of 30
- Sell on March 27th (@ $4.46) when the RSI reached 65
- A profit of 12% was realized
- Buy on May 27th (@ $1.60) when the RSI bottomed below an RSI of 30
- Continue to hold as RSI has not yet reached a minimum RSI of 65.
Tilray (TLRY):
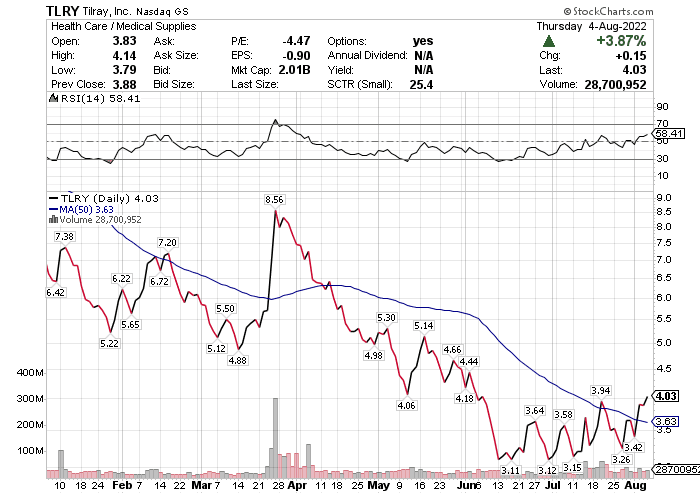
- Buy on January 27th (@ $5.22) when the RSI bottomed below an RSI of 30
- Sell on March 27th (@ $8.56) when the RSI reached 70
- A profit of 64% was realized
- Buy on May 11th (@ $4.06) when the RSI bottomed below an RSI of 30
- Continue to hold as RSI has not yet reached a minimum RSI of 65.
Canopy Growth (CGC):
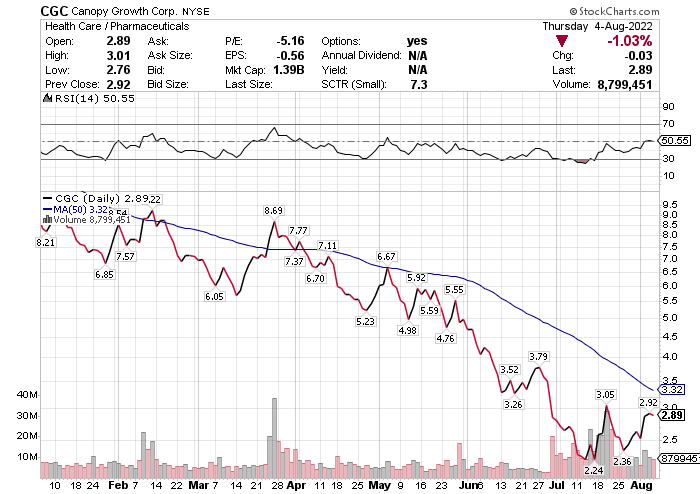
- Buy on January 27th (@ $6.85) when the RSI bottomed below an RSI of 30
- Sell on March 27th (@ $8.69) when the RSI reached 65
- A profit of 27% was realized
- Buy on April 27th (@ $5.23) when the RSI reached an RSI of 30
- Continue to hold as RSI has not yet reached a minimum RSI of 65.
Organigram (OGI):
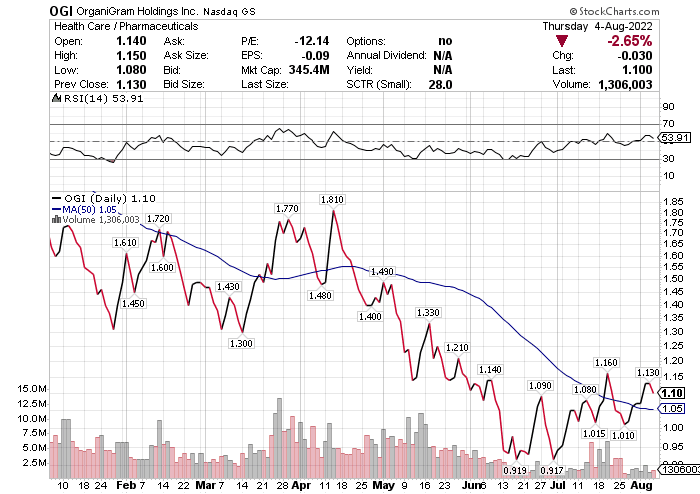
- Buy on January 27th (@ $1.31) when the RSI bottomed below an RSI of 30
- Sell on March 27th (@ $1.75) when the RSI reached 65
- A profit of 33% was realized
- Buy on July 11th (@ $2.25) when the RSI bottomed below an RSI of 30
- Continue to hold as RSI has not yet reached a minimum RSI of 65.
A Gain Of 32% OR A Loss of 44% – Your Choice!
Had you invested $2,000 in each of the 5 stocks above you would have realized a 32% return since January 27th, 2022, as compared to a loss of 44% had you bought, and held, the above stocks during the same time period. That’s the best case scenario as it is doubtful that you would have been able to buy at the absolute bottom and sell at the exact top of any run but, even if you bought in during the days leading up to the bottom or the days following and exited in the week surrounding the top you would have done very well.
Conclusion
As you can see from the above examples, the RSI never lies. Just buy when the stock drops below the RSI of 30 and then hold the stock until the RSI reaches 65, and preferably 70, and then sell. It’s that simple!
Related Article From the munKNEE Vault:
1. Ride the Market Waves With These 6 Momentum Indicators