If you are disciplined with saving and investing when you are young, you are almost guaranteed to become a stock market millionaire! This article outlines 3 of the 7 steps necessary to help you build your wealth in the stock market.
The original article has been edited here for length (…) and clarity ([ ])
[In a previous article entitled How To Become A Stock Market Millionaire – Part 1: (The Plan) the author put forth 6 questions to ask yourself when putting together your investment plan and provided answers for each. This articles is a continuation of that article covering Steps 2 through 4.]Step #2: Open Your Account
I know, it’s basic, but hey, we need to cover it. You have all sorts of options when it comes to investment accounts. You can choose a place like Vanguard, which I love, but you need to have a decent amount of money ready to invest at the start. To open a new mutual fund with Vanguard, you need $3,000 which many don’t have. Because of this, I recommend a handful of online brokers found here.
- For those that have more than $10,000 ready to invest, Vanguard is the best option. You can invest in a couple of mutual funds, be fully diversified, and save money with their low fees.
- If you have less than $10,000 to invest, then Schwab is a great option. You can invest in a variety of low cost Schwab mutual funds and exchange traded funds.
- If you have $1,000 or less to invest then M1 Finance or Betterment are your options. Of course, if you have more than $1,000 to invest, M1 Finance and Betterment are great options too. They are not just for those without a lot of money to invest.
- When it comes to M1 Finance, they allow you to choose a pre-built, low cost portfolio of ETFs to invest in. You can also build your own custom portfolio as well out of ETFs or stocks. The best part about M1 Finance is that if you do invest in stocks, you pay zero commissions. It’s an incredible deal and great service. I use them for my dividend portfolio. You can get started with M1 Finance by clicking here.
- As for Betterment, they automate the majority of the steps to become a stock market millionaire. In 10 minutes you can open an account, select a goal and set up an automatic transfer and you are done. Betterment does the rest for you! Just as awesome, you’re diversified from the start and the fees are super low. In other words, if you just want to start investing with the least amount of work possible, Betterment will do all the work to make you a stock market millionaire…I highly recommend the Betterment service for many readers. You can get started with Betterment by clicking here.
Step #3: Set Up Automatic Transfers
Once you have your account open, you need to set up a re-occurring transfer into your account each month. All the brokers I listed above allow for ongoing transfers.
- If you want to become a stock market millionaire, you need to invest in the stock market on a regular basis. You can’t just invest $1 and wait for it to become $1 million. I say that because if you invest $1 and it grows at 8% annually, it will take 173 years until you become a stock market millionaire. I hope you see the problem with that.
- If you invest $100 every month, [however,] and earn 8% annually, it will take you just 53 years to become a stock market millionaire. Now we are talking!
- Even better, if you save $667 per month and invest it in the stock market you will become a stock market millionaire in just 30 years!…
The median U.S. income is $59,039 per year. If you contribute 10% of your salary into your 401k, you are saving $491 each month. That leaves you with just $176 to invest after tax. (I didn’t include employer matches in this since some people don’t get employer matches. If you do, then you’ll be a stock market millionaire in less than 30 years.) Set up an automatic transfer to your investment account monthly for $176.
If you want to do this yourself, here is your blueprint:
- take your annual salary and multiply by 10%
- this is the amount you need to invest in your 401k plan at work. If you don’t have a 401k plan, open an IRA and save the 10% there.
- take $8,004 and subtract the number you are saving from the above step
- divide this number by 12 to get your monthly saving amount
Here is another example to drive this point home. You make $35,000 a year. If you save 10% of this in your 401k plan, that is $3,500. We then take $8,004 and subtract $3,500 to get $4,504. We take this number and divide by 12. The answer of $375 is how much more we need to invest each month to be a stock market millionaire in 30 years…
[Below] is a chart I created…[that] shows you how much you need to save per month based on your current age to reach millionaire status at a given age. Your current age is found down the left hand side of the chart and your desired retirement age is across the top.
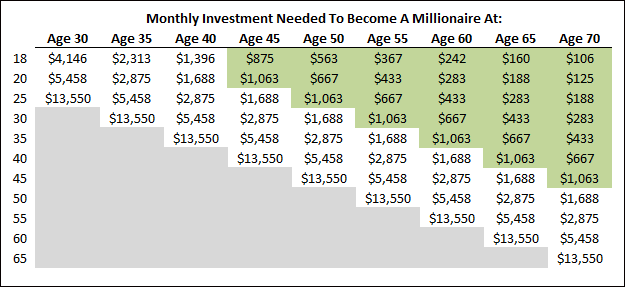
Note the figures highlighted in green. I feel that these are attainable numbers if you invest 15-20% of your income. The great thing is if you are disciplined with saving and investing when you are young, you are almost guaranteed to become a stock market millionaire!
The key takeaway from Step #3 is to invest as much as you can on a regular basis. I would rather be a little less comfortable now and save a lot than not save anything now and end up having to work the rest of my life. The more you invest, the quicker you will become a stock market millionaire.
For those reading this who want to enjoy life now, but are a little short on extra money to invest, here are some simple ways you can make an extra $250 a month in your spare time to invest.
- Survey Junkie. As I mentioned earlier, spend 30 minutes before bed or on the train into work and you can easily earn over $150 a month. Click here to get started.
- Swagbucks. Also mentioned earlier, take surveys, play games, surf the internet, shop online, and more. You earn points that you can easily turn into cash. New users get $3 just for signing up! Click here to get started.
- Instacart. You can make money shopping for others. Just pick up some things while running your errands and you have extra money to invest.
- Uber Eats. Partner with Uber and you can deliver food to customers. How much you make is completely up to you based on the number of hours you work. To get started with the approval process, click here.
Step #4: Pick Low Cost Investments
Many people don’t realize that they pay fees annually on their investments. Every mutual fund and ETF that you invest in, you pay a fee on. You never see the bill for it because the fee comes out of the return of the fund itself. For example, if your mutual fund charges a 1% management fee and your statement shows it returned 5% this year, it actually returned close to 6%. You only earned 5% of that return.
You might be thinking 5% is good because you’re going to be a stock market millionaire based on Step #3 alone! While this is true, you can get to millionaire status faster by picking low fee investments and you’ll end up with more money too.
Here is an example of how costly investment fees are.
- Let’s say you have $1,000 invested in a mutual fund that has a management fee of 1.25%. This is about the average for a stock mutual fund. In 30 years after earning 8% annually, you will have paid just shy of $1,200 in fees.
- In contrast, if you pay 0.30% in management fees, you will have paid about $350 in fees.
Some may be looking at the difference of $850 and not bat an eye. If this is you, you need to read my post on compound interest and then come back. While $850 on the surface might not seem like much, it is. That $850 comes from your investment account. If you left that $850 invested, it would be able to compound upon itself and your balance would grow even faster.
Here is your investment balance after 30 years.

That $850 difference in fees ends up costing you over $2,000 in 30 years!
As your investment balance grows, so do the fees you pay. If you have $50,000 invested, you are paying almost $60,000 in fees over 30 years by investing in a mutual fund that charges 1.25%. If you instead invest with a fund that charges 0.30% over 30 years you will have paid just $17,000 in fees.
Here is what your investment balance looks like after 30 years.
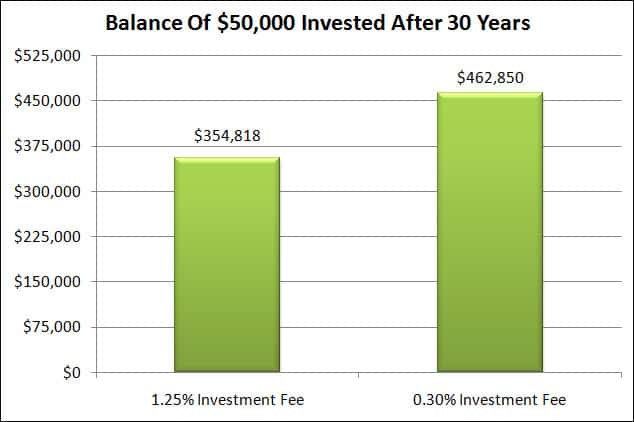
By choosing an investment with a lower fee, you would have over $100,000 more in savings! This could mean you retire a few years sooner if you simply invest in low cost investments. The bottom line is that fees matter…
What is considered a low fee? You should not be paying over 1% in any circumstance for an investment. There are many low cost mutual funds and ETFs that you can invest in that will not cost you and arm and a leg. Vanguard, M1 Finance, and Betterment are excellent when it comes to low fees. Schwab is good too if you pick the right investments. That is your money. Don’t give it up so easily.
Final Thoughts
So there you have it, your step-by-step guide (Steps #2 through #4) for how to become a stock market millionaire. I told you that it was easier than you thought! If you follow these steps, you will be well on your way to investingsuccess. For Step #1 go here and go here for Steps #5 through #7
Related Articles From the munKNEE Vault:
1. How To Become A Stock Market Millionaire – Part 1: (The Plan)
Becoming a stock market millionaire is much easier than you think because if you take about an hour or two of your time now to create an investment strategy, you are 95% of the way to becoming a stock market millionaire. So what exactly do you need to know to become a stock market millionaire? I’ve outlined all the steps below to help you build your wealth in the stock market.
2. Follow These Steps & Become A Stock Market Millionaire – Guaranteed
Here’s your step-by-step guide for how to become a stock market millionaire. If you can follow them I can virtually guarantee you will become a stock market millionaire!
For the latest – and most informative – financial articles sign up (in the top right corner) for your FREE tri-weekly Market Intelligence Report newsletter (see sample here)
Support our work: like us on Facebook, follow us on Twitter, or share this article with a friend. munKNEE.com – Voted the internet’s “most unique” financial site! (Here’s why)