Equity markets in the U.S. have bounced back over the past couple of weeks and have shown strong momentum to the upside. We are now well into the fourth year of a rising equity market and we might now reasonably ask the obvious question, “When might this end?”
The above introductory comments are edited excerpts from an article* by “Armchair Quarterback” as originally posted on SeekingAlpha.com under the title The Bull Market In Equities Has A Long Way To Run.
The article goes on to say in further edited excerpts:
First, let’s put the current interest rate and equity market into historical context.
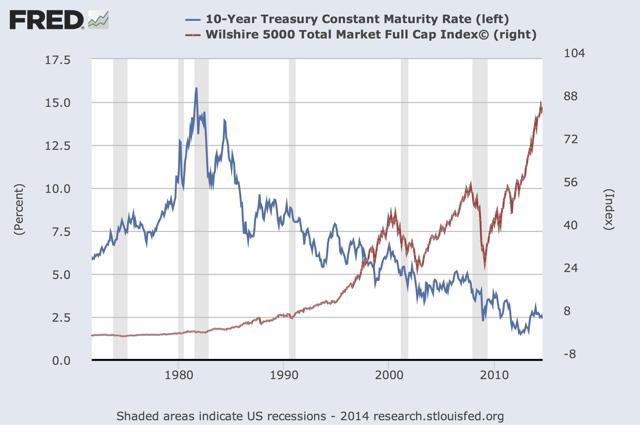
We have been experiencing a prolonged bull market in USTs since the early 1980s and we are in the midst of a strong equity bull market dating back to the end of 2009. The most recent equity bear markets can be seen on the graph (sharp fall in the red line above) coinciding with the last two recessions, in 2001 and 2007-2009, so:
- How long will these two bull markets run?
- Do we see any signs of a turnaround?
To answer this question, we look a little closer at the current business cycle to assess where we are in its progression.
Interest Rates
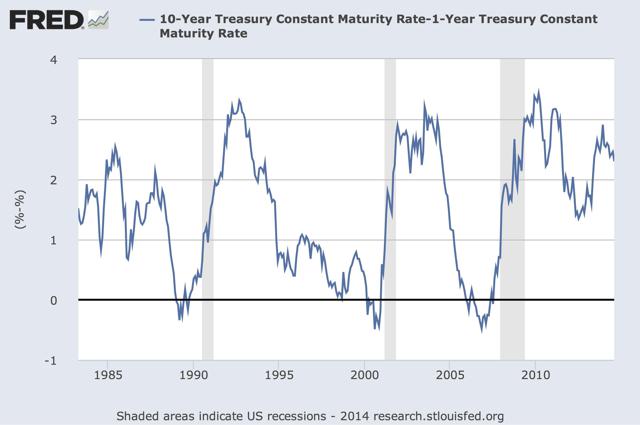
Historically, the slope of the yield curve has been an accurate predictor of the business cycle. In the graph below we have plotted the difference between the 10 year constant maturity (“CMT”) UST rate and the 1 year CMT UST rate. This indicator fits well with the business cycle.
- The slope accelerates upward through a recession and is at its steepest soon after a recession during the early phase of an economic expansion.
- The slope reduces or, in other words, the yield curve flattens, through most expansions,
- eventually turning negative (yield curve inverts) just prior to a recession.
As you can see above, there were a couple of false readings of inverted yield curves with no immediate recession but there were no instances of a recession while the curve was flattening after displaying a positive slope. Even the false readings were slight, temporary, and eventually predicted a recession.
The overall cycle of the shape of the yield curve fits nicely with the economic cycle and indicates that we are currently nowhere near a recession.
…How long can this expansion run?…
[Below] we present our thoughts on commercial lending activity, banking reserves, and household credit capacity. All indicate plenty of capacity and the ability to drive the economy forward for several years to come.
1. Commercial lending is expanding
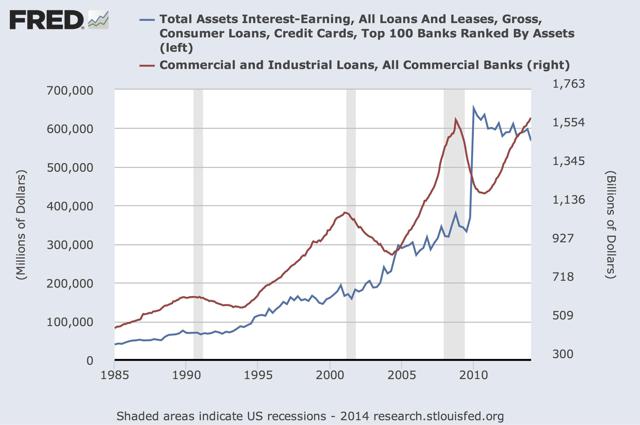
Bank balance sheets have peaked but this masks underlying loan growth. Although total interest bearing assets of the top 100 banks in the U.S. have remained level (even decreasing slightly) since 2010, underlying commercial and industrial loans (red line below) have grown at a good pace.
Total assets of banks have been skewed by the extraordinary purchase of non-productive financial assets immediately following the global financial crisis and don’t imply consequences for the economy. However, the rate of change of commercial and industrial loans fits nicely with the business cycle.
As we can see from the graph, over the past three cycles, loan growth (the red line above)
- bottoms soon after a recession,
- turns upward,
- accelerates,
- tops out just before or in the midst of a recession and
- turns sharply downward until private sector credit demand returns.
Currently, we see loan growth (the red line) on an upward slope with no indication of flattening or reversing.
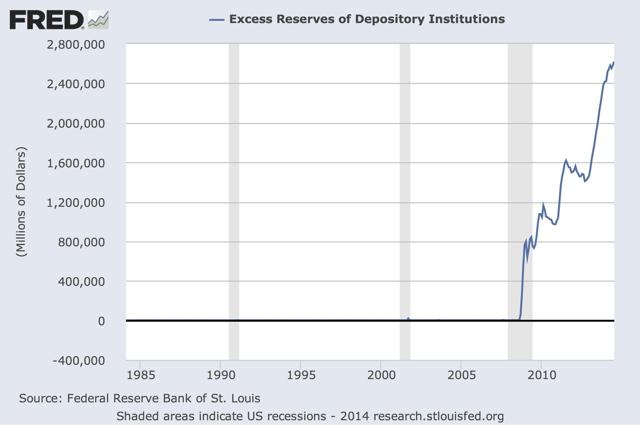
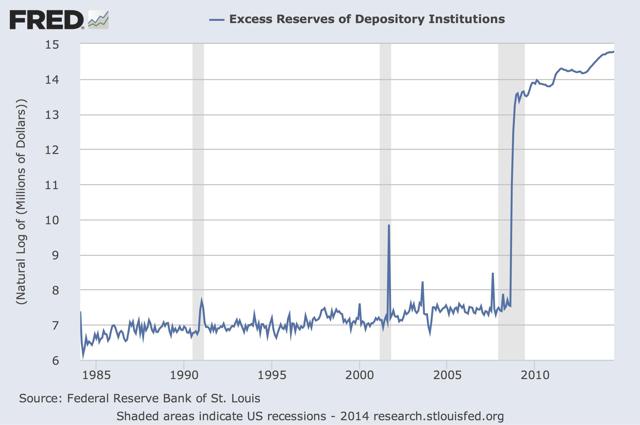
2. Excess reserves are at extremely high levels
Reserves are high in part due to changing regulations, but at these levels, credit creation will… accelerate as confidence and sentiment continue to improve.
The picture looks the same even when considering the data in log scale.
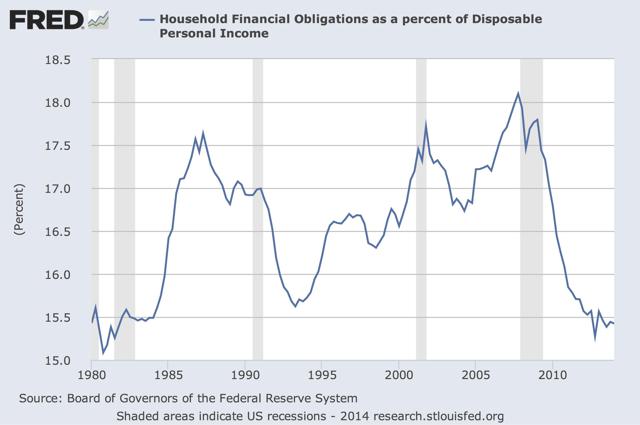
3. Household balance sheet repair near complete
Household debt service payments as a percentage of disposable income are the lowest they have been in three decades. Although mainstream media stories abound of pinched consumers facing hard times, the data indicates that households certainly have the capacity to increase spending and incur additional debt to power the next phase of economic growth.
Conclusion
The current S&P P/E ratio is 18.55, as reported by the Wall Street Journal data center, and 19.39 as reported by Barron’s. This is relatively high but within a historical range we might call normal.
Consensus estimates of earnings vary, but with our bullish view on the market, we would not be surprised to see EPS for the S&P 500 grow by between 8% and 10% year-over-year.
Based on our expectations of earnings growth and a slight expansion in the P/E multiple, we would not be surprised to see the S&P 500 index reaching 2400 by December 2015.
In summary, we are bullish on the economy and the equity markets in the U.S.. We see no signs of disruption beyond an exogenous geopolitical event.
Editor’s Note: The author’s views and conclusions in the above article are unaltered and no personal comments have been included to maintain the integrity of the original post. Furthermore, the views, conclusions and any recommendations offered in this article are not to be construed as an endorsement of such by the editor.
* http://seekingalpha.com/article/2433545-the-bull-market-in-equities-has-a-long-way-to-run?ifp=0 (© 2014 Seeking Alpha ) For more detailed insights into the article above you are encouraged to use the aforementioned URL to access the article on Seeking Alpha and read the more than 2 dozen comments offered by readers of the article on said site.)
If you liked this article then “Follow the munKNEE” & get each new post via
- Our Newsletter (sample here)
- Twitter (#munknee)
Related Articles As Posted On munKNEE.com
If the past long-term cyclical correlations between interest rates, equities, and commodities were to play out as they have done going back to the 1880s, U.S. stocks and interest rates should continue to rise as commodities either fall or underperform according to a 60-year cyclical pattern model referred to as The Market Map. Read More »
Trying to predict markets more than a couple of days into the future is nothing more than a “wild ass guess” at best but, that being said, we can make some reasonable assumptions about potential outcomes based on our extensive analysis of these 6 specific price trend and momentum indicators. Read More »
4. No Recession Until These 6 Indicators Are Triggered
Despite a long list of major risks to the global economy, the trend for the stock market is still UP until proven otherwise. At this stage it is absolutely critical to be cautious and watch for signs of a market correction or peak, but it is our view that a recession won’t take hold until the following 6 key indicators are triggered. Read More »
5. Mixed Signals About Direction of Stock Market Abound – Here Are 10
6. Bubble-level Valuations Don’t Cause Bear Markets! These Factors Do
So much analysis we see and hear lately is concerned with whether the stock market is in a bubble or not. The truth of the matter, however, is that bear markets do not begin due to bubble-level valuations being reached and then bursting, but in anticipation of half a dozen mitigating factors as outlined in this article. Read More »
7. What Are the 2 Catalysts That Cause Major Market Corrections Telling Us Today?
There are a number of potential pitfalls out there for the market but, right now, the behavior of the main catalysts for a major correction suggest that there continues to be more right than wrong with the market. Let me explain. Read More »
8. A Stock Market Correction/Crash May Not Occur For Quite A While – Here’s Why
Some investors are sure we’re heading for a crash because we’ve had such an uninterrupted rise in stocks but these things can last much longer than most people realize. While a crash is never out of the realm of possibilities, just because stocks are up doesn’t mean they have to immediately crash. Eventually they will be right. It’s the timing that gets you on these type of calls. Read More »
9. Stock Market Bull Likely to Continue for Another 2-3 Years – Here’s Why
If you follow the mainstream financial print media, you may have seen that many prominent publications have recently called this stock market a ‘bubble’ and many are waiting for the elusive stock market crash! In our view, however, such bearish ‘bubble’ sentiment is precisely the reason why, in our opinion, the party is likely to continue for at least another 2-3 years. Here’s why & what sectors to take full advantage of. Read More »
The pullback I’ve been warning you about in the U.S. equity markets is finally at hand but, once this pullback in the broad stock indices is over, the Dow Jones Industrial will lead the way higher yet again, and catapult to 31,000 over the next three years, with gold reaching $5,000, silver $125 and select individual stocks in the mining sector spinning off gains of 2,000%, 3,000% and even more. No, I’m not out of my mind. Quite to the contrary, I believe I am the one analyst who really understands the forces that are building to enable such to occur. Read on to learn about my enviable track record over the years and specifically why such gains will be realized over the next three years. Read More »
 munKNEE.com Your Key to Making Money
