At the beginning of a hyperinflationary cycle, the stock market virtually always makes substantial gains which is just reflecting the sheer weight of printed money…After the initial enthusiasm the stock market loses its lustre and falls in tandem with the economy into a deflationary depression. The U.S. is now slowly entering such a hyperinflationary phase…and with it the dollar is likely to start a severe decline this year on its way to the intrinsic value of ZERO. This will not only happen in the U.S. but also later in Japan, the Eurozone and the UK. Here’s what that means for the future price of gold.
So says Egon von Greyerz (goldswitzerland.com) in edited excerpts from his original article* entitled Trade of the decade.
[The following article is presented by Lorimer Wilson, editor of www.munKNEE.com (Your Key to Making Money!), the FREE Market Intelligence Report newsletter (sample here) and has been edited, abridged and/or reformatted (some sub-titles and bold/italics emphases) for the sake of clarity and brevity to ensure a fast and easy read. This paragraph must be included in any article re-posting to avoid copyright infringement.]
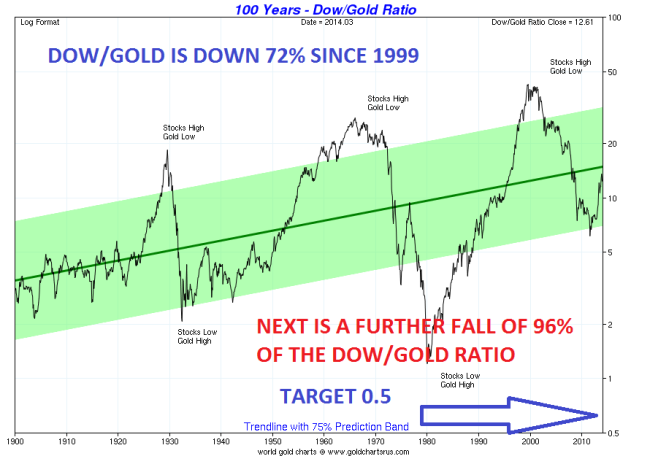
Gold always reveals the destruction of paper money as the graph of the Dow/Gold ratio below shows. Since 1999 the Dow has fallen 72% in real terms (i.e. as measured against Gold). The ratio made a bottom in 2011 when Gold was $1,900. We have been forecasting new highs before 2014 is over and we still believe that is likely. Thus the Dow/Gold ratio could soon turn down and start its journey to below 1 to possibly 0.5. In 1980 the ratio was 1 with gold and the Dow both around 850. If the ratio overshoots, which is likely, and goes to 0.5 that would mean that the Dow would fall another 96% from here against gold.

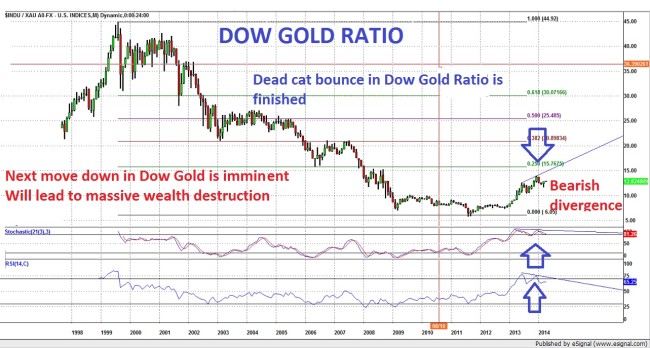
A look below at the monthly chart of the Dow/Gold ratio shows a dead cat bounce of 20% of the whole down move since 1999. Technically this correction now seems to be finishing with the momentum indicators showing bearish divergence on the monthly chart. In addition the Dow could form an important cycle top in April/May.

At what level would we find Gold and the Dow if the ratio hits 0.5? That would clearly depend on the amount of hyperinflation we will see. It could mean the Dow at 6,000 and Gold at $12,000 but if hyperinflation really takes off, we could see Gold at $50,000 and the Dow at 25,000.
Like this article? Get them all via our bi-weekly newsletter, Facebook, Twitter or RSS feed
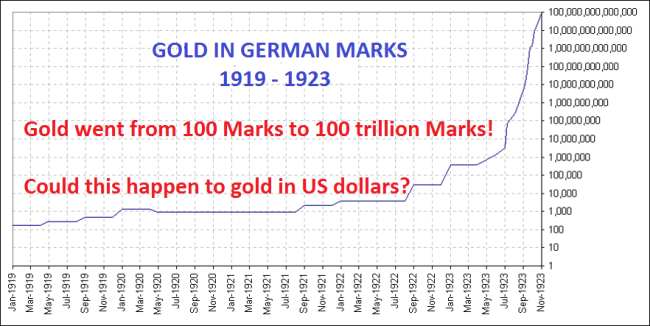
Furthermore, we mustn’t forget what happened in the Weimar Republic when Gold went from 100 marks in 1918 to 100 trillion marks in 1923. In that scenario I would expect the ratio to be a lot lower because it would be unlikely to see the Dow at 50 trillion during a hyperinflationary depression.

Conclusion
The trade of the decade, and possibly of the century, is likely to be short the Dow and long Gold.
[Editor’s Note: The author’s views and conclusions in the above article are unaltered and no personal comments have been included to maintain the integrity of the original post. Furthermore, the views, conclusions and any recommendations offered in this article are not to be construed as an endorsement of such by the editor.]
*http://goldswitzerland.com/trade-of-the-decade/ (©2014 GoldSwitzerland)
Related Articles:
1. Beginnings of Massive Stock Market Correction Developing: Don’t Delay, Prepare Today!
No stock can resist gravity forever. What goes up must eventually come down. This is especially true for stock prices that become grotesquely distorted. We have been – and still are – living in another dotcom bubble, and – like the last one – it is inevitable that it is going to burst. Read More »
2. Stock Market Will Collapse In May Followed By Major Spike in Gold & Silver Prices! Here’s Why
The unintended consequences of five years of QE are coming home to roost! In May or early June the stock market parabola will collapse…followed by a massive inflationary spike in commodity prices – particularly gold & silver – that will collapse the global economy. Read More »
3. No Problems Foreseen – Yet – from Sky Rocketing Margin Debt BUT
Is the latest credit-balance trough a definitive warning for U.S. equities? In this article we examine the numbers and study the relationship between margin debt and the market, using the S&P 500 as the surrogate for the latter. Read More »
4. 3 Historically Proven Market Indicators Warn of an Impending Market Top
It’s frustrating to see key stock indices keep pushing higher when historically proven market indicators are all warning of a crash ahead. Irrationality is exuberant to say the very least, and that’s why I believe this rally is counting its last days. Read More »
5. Time the Market With These Market Strength & Volatility Indicators
There are many indicators available that provide information on stock and index movement to help you time the market and make money. Market strength and volatility are two such categories of indicators and a description of six of them are described in this “cut and save” article. Read on! Words: 974 Read More »
Stocks are pulling back in preparation for one final mind-blowing surge to top off this five-year bull market. Gold, on the other hand, looks like it is setting up for a final bear market capitulation phase where every gold bug finally throws up their hands in disgust and jumps over to the stock market right as it’s putting in a final bubble top. For those…that are sitting in cash, this final capitulation is going to represent one of the greatest buying opportunities of this generation. Read More »
7. $1,300-$1,400 Gold Is Unsustainable In the Long-term – Here’s Why
we believe that gold staying between $1,300-$1,400 is unsustainable in the long-term. The price might drop down temporarily, but the economics don’t lie. Miners have to turn a profit in producing gold, and they can’t do it at the current price if gold grades continue to decline and new discoveries aren’t found and put in the pipeline. Read More »
8. Gold Dropping to $900 & Silver to $15 By End of June Before Going Parabolic!
Back in early May, 2013, I correctly forecast the lows in gold & silver which occurred 2 months later. Today, my new analyses of gold & silver indicates they both will show further weakness during the 2nd quarter of 2014 before both jumping dramatically in price before the end of 2014. Below are the specific details of my forecasts (with charts) to help you reap substantial financial rewards should you wish to avail yourself of my insightful analyses. Read More »
9. Gold’s 2014 Playbook: $1,050 This Summer; $1,800 – $2,000 By Year End! Here’s Why
While I know this is tough to hear, as most of you are gold bugs, I am confident that the banking cartel has a purpose, and that purpose is to set up what will probably be one of the most lucrative long side trades in the metals of this entire secular bull market. Our job right now is to be patient and wait for that yearly cycle low later this summer. I think that low is going to drop at least down to retest $1200, and if the cartel has its way, they will push gold back to $1050 before this is over. Read More »
10. “Golden Cross” Suggests MUCH HIGHER Prices Coming for Gold, Silver & PM Equities
History is testament that there exists monumental probability (76% to 100%) that 2014-2016 will witness impressive gains for Gold, Silver and Precious Metal Equities…across the board. Below are charts of 8 different forms of precious metals assets that show that Golden Crosses are a fait accompli or are about to experience imminent completion thus heralding an immediate new Bull Market and that the forth-coming secular bull markets in all forms of precious metals may well far surpass the forecasts herein stated. The focus of the following analysis is to prove the predictable accuracy and timing of the The Golden Cross. Read More »
11. Gold Price Forecasts (Update): $5,000 to $11,000 In 2 to 5 Years
During 2011 into 2013 I kept a record of those individuals who expected gold to rise substantially in the coming years and presented updated summaries in a number of articles (see links below). Below are additional or recently updated forecasts by 11 prognosticators whose projections are surprisingly consistent, on average, with previous such estimates. Read More »
We are now starting the hyperinflationary phase in the USA and many other countries – and this will all start in 2014. What will be the trigger? The answer is simple – the fall of the U.S. dollar. Read More »
 munKNEE.com Your Key to Making Money


For those with large portfolios who can gamble BIG and not flinch if they lose , the above suggestion might make great financial sense but for the rest of us, it is always better to be careful than be sorry…