Ever since the Dow broke the 14,000 mark and the S&P broke the 1,500
 mark, even in the face of a shrinking GDP print, a lot of investors and commentators have been anxious. Some are proclaiming a rocket ride to the moon as bond money now rotates into stocks….[while] others are ringing the warning bell that this may be the beginning of the end, and a correction is likely coming. I find it a bit surprising, however, that no one is talking of the single largest driver for stocks in the past 4 years – massive monetary base expansion by the Fed. (This article does just that and concludes that the S&P 500 could well see a year end number of 1872 (+25%) and, realistically, another 28% increase in 2014 to 2387 which would represent a 60% increase from today’s level.) Words: 600; Charts: 3
So writes the Macro Investor in edited excerpts from his most recent post* on Seeking Alpha entitled S&P To 1872 From Quantitative Easing.
This article is presented compliments of www.munKNEE.com (Your Key to Making Money!) and may have been edited ([ ]), abridged (…) and/or reformatted (some sub-titles and bold/italics emphases) for the sake of clarity and brevity to ensure a fast and easy read. Please note that this paragraph must be included in any article re-posting to avoid copyright infringement.
The article goes on to say in further edited excerpts:
Comparison of S&P 500 Increase vs. U.S. Monetary Base Expansion
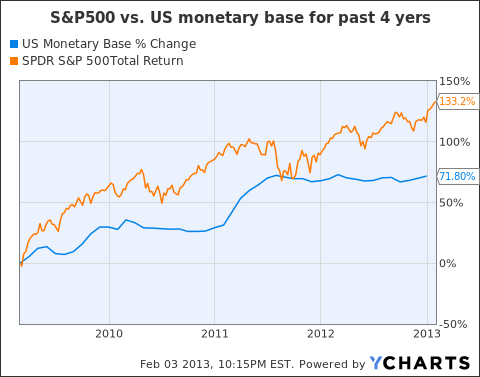
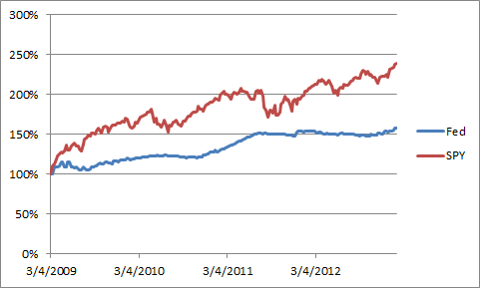
[As mentioned in the opening paragraph,] I find it a bit surprising that no one is talking of the single largest driver for stocks in the past 4 years – massive monetary base expansion by the Fed [see chart below].To estimate [the affect of the] monetary base expansion on the S&P 500, I did a simple calculation. Projecting the monetary base in the future is tricky, so I took the Federal Reserve Balance Sheet as a proxy. I plotted the S&P 500 against the Fed’s Balance Sheet on a weekly basis since the market bottom on March 2009 [see chart below].
(click to enlarge)
Effects of QE on Past S&P 500 Performance
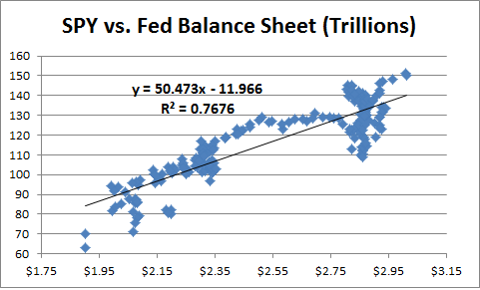
From the [above] chart, it is clear that the Fed’s balance sheet is a good proxy for the monetary base [so] I ran a regression model [see chart below] to see how the S&P 500 has changed with the Fed’s balance sheet.
The R2 at ~77% is pretty high, which means that 77% of the price movement in the S&P 500 can be explained by changes in the Fed’s balance sheet….
Projected Effect on Future Levels of S&P 500
We know that the Fed will be expanding its balance sheet by at least $85 billion each month from QE, which means the ending balance will be ~$4T. Substituting in the equation, this means:
- a end year 2013 value of SPY of ~187, or a S&P 500 of ~1872, which means a 25% increase from current levels.
- If QE was to continue for 12 more months in 2014, the end 2014 value of SPY would be 239, or a S&P 500 of 2387, or another 28% increase in 2014
- which means a 60% increase from current levels by end of 2014.
Cross Checking Confirmation
[The above] may seem like big increases, so let’s cross check this with historical P/E ratios. Even if earnings were to be flat for the next 12 months, at 1872, S&P 500 will have a backward looking P/E of 19. If earnings were to increase by 5%, backward looking P/E would be 18, and if they were to increase by 10%, backward looking P/E would be 17. As a comparison, the last time the S&P 500 was at 1500, the backward looking P/E was 17.6 so these numbers are not unrealistic at all.How to Maximize Profits
How can an investor profit from this trend? Today, I bought January 2014 strike 115 calls on the 3x leveraged ETF on SPY (UPRO) for $11.5. If the S&P increases by 12.5% from this level (half of the predicted 25%), then UPRO will end the year at ~140. This will mean about 120% return on the calls in a year. Breakeven will require about 7-8% increase in the S&P 500, which I expect to come before summer.
Conclusion
This market, fueled by massive amounts of liquidity being pumped by the Fed, has legs.
Editor’s Note: The author’s views and conclusions are unaltered and no personal comments have been included to maintain the integrity of the original article. Furthermore, the views, conclusions and any recommendations offered in this article are not to be construed as an endorsement of such by the editor.
*http://seekingalpha.com/article/1156031-s-p-to-1872-from-quantitative-easing
Register HERE for Your Daily Intelligence Report Newsletter
It’s FREE
The “best of the best” financial, economic and investment articles
An “edited excerpts” format to provide brevity & clarity for a fast & easy read
Don’t waste time searching for informative articles. We do it for you!
Register HERE and automatically receive every article posted
“Follow Us” on twitter & “Like Us” on Facebook
Related Articles:
1. 5 Reasons To Be Positive On Equities
For the month of January, U.S. stocks experienced the best month in more than two decades [and the Dow hit 14,009 on Feb. 1st for the first time since 2007]. Per the Stock Traders’ Almanac market indicator, the “January Barometer,” the performance of the S&P 500 Index in the first month of the year dictates where stock prices will head for the year. Let’s hope so…. [This article identifies f more solid reasons why equities should do well in 2013.] Words: 453
2. World Economy & Market Forecast: More Sunshine & Less Stormy Weather Ahead
It seems clear that there are a number of investors who have gained confidence in the global economy and are seeking to capture the growth opportunities taking place around the world. With the European crisis comfortably in the rear view mirror and global central banks taking the position that they will continue their easing policies, investors have taken their foot off the brake and have begun to accelerate….We see more sunshine and less stormy weather ahead [and explain why that is the case in this article]. Words: 695; Charts: 3
3. Start Investing In Equities – Your Future Self May Thank You. Here’s Why
As Winston Churchill once said: “A pessimist sees the difficulty in every opportunity; an optimist sees the opportunity in every difficulty” and in that vain I challenge all readers to fight off the negativity, see long-term opportunity in global equity markets and, most importantly, remain invested. Your future self may thank you. Words: 732; Charts: 6
4. What Recovery? Contradictions Between Reality & Political Claims Are Everywhere!
There is no recovery, regardless of what the elite and their minions in the media want you to believe. The economy is sick. It was made so by the malpractice of government and will become even weaker as government continues to administer the poison that got us to this point. The political class’s version of remedy is akin to the medical profession’s practice of bloodletting. Neither does any good and both, carried to extreme, are fatal. [Let me explain more fully.] Words: 548
5. Ignore Wall Street Cheerleaders: Market Technicals, Fundamentals & Other Info Says Otherwise!
[In spite of what] the typical Wall Street cheerleaders, I mean strategists, are predicting, we see the equity market ever more closer to its cyclical top, miners about to retest a major bottom and hard assets with a new catalyst. [This article analyzes 9 pieces of information, complete with charts, that show what is actually going on in the marketplace at this point in time and what the short-term future holds.] Words: 930; Charts: 8Without economic growth, and real economic growth at that, there can be no meaningful long-term economic recovery in the developed countries. Growth or lack thereof will have to be reflected in the financial markets over time. Currently, I continue to see a disconnect between where the financial markets are pricing things, and where I think they ought to be pricing things. Words: 784
At some point we are going to see another wave of panic hit the financial markets like we saw back in 2008. The false stock market bubble will burst, major banks will fail and the financial system will implode. It could unfold something like this: Words: 660
 munKNEE.com Your Key to Making Money


