The mainstream media wants us to believe that government spending is good for employment [but my analysis shows exactly the opposite. As outlined below, it clearly demonstrates that]….countries with higher government involvement have higher government spending, higher personal income taxes, higher unemployment and a weaker economy as a consequence. [Below are the facts to back up those claims.] Words: 525; Charts: 4
So writes Katchum in edited excerpts from a recent post* on his blog (http://katchum.blogspot.ca) entitled The Size Of Governments And The Effect On Their Economies.
This article is presented compliments of www.munKNEE.com (Your Key to Making Money!) and may have been edited ([ ]), abridged (…) and/or reformatted (some sub-titles and bold/italics emphases) for the sake of clarity and brevity to ensure a fast and easy read. Please note that this paragraph must be included in any article re-posting to avoid copyright infringement.
Katchum goes on to say in further edited excerpts:
It seems obvious to me that countries with a lot of government spending would create unemployment…[because] welfare states tend to eliminate the urge for people to look for jobs.
Government Spending as a % of GDP
The following chart gives the amount of government spending as a percentage of the country’s GDP. From it we note that most developed countries (Japan, Canada, the United States and the countries of Europe, for example) have a lot of government spending, while emerging markets like Brazil and especially countries in the Asia-Pacific region (China, India, Hong Kong, Singapore, Taiwan) have less government….Based on this chart we can conclude that the stronger economies are the ones with the least government (Hong Kong, Singapore, Taiwan), while countries like Sweden, France and Belgium…[are] very inefficient due to large government involvement.
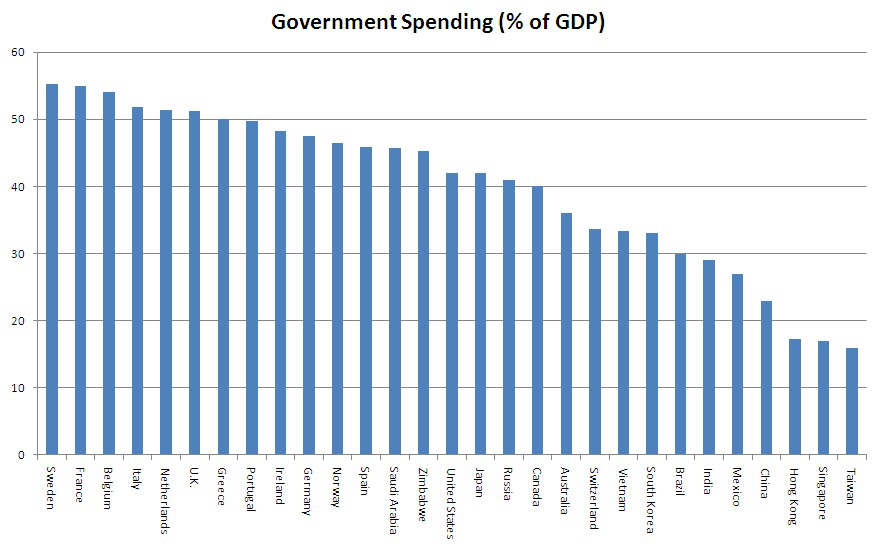 |
| Chart 1: Government Spending as a Percentage of GDP |
Fact #1: Higher Gov’t Spending = Higher Unemployment
As we add the most recent 2012 unemployment numbers to Chart 1, we get Chart 2. As you can see on Chart 2, countries with higher government involvement have, as a consequence, higher unemployment so there is a direct correlation between the size of government and unemployment. The PIIGS of Europe are the countries with highest unemployment in the world.
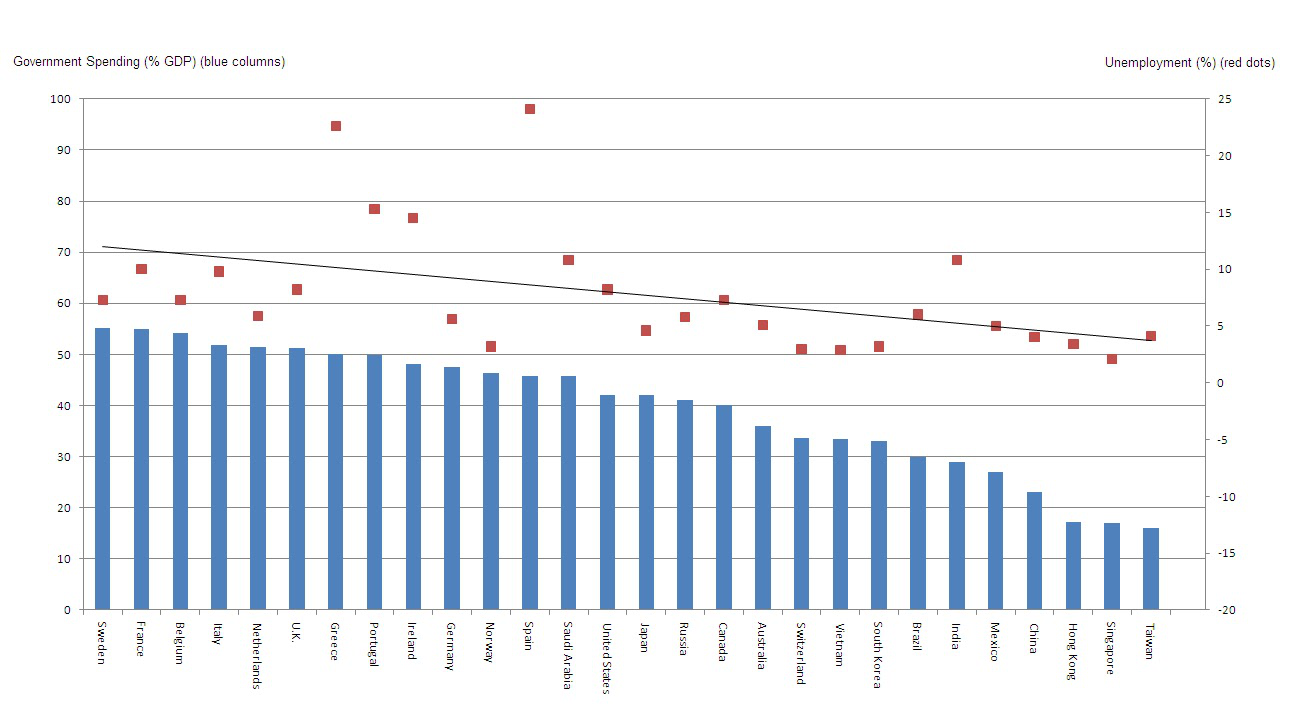 |
| Chart 2: Government Spending (% GDP) VS. Unemployment (%) |
Fact #2: Higher Gov’t Involvement = Higher Gov’t Debt
…A look at government debt-to-GDP for each country [shows that,] as more and more government is involved in the economy of a country, politicians will tend to spend more and more (at the expense of the taxpayer). The more government there is in a country, the more government debt there is as a percentage of GDP. The two countries that have the highest debt in the world are Japan and Greece with debt above 150%. The countries with the lowest government budgets are Saudi Arabia and Russia.
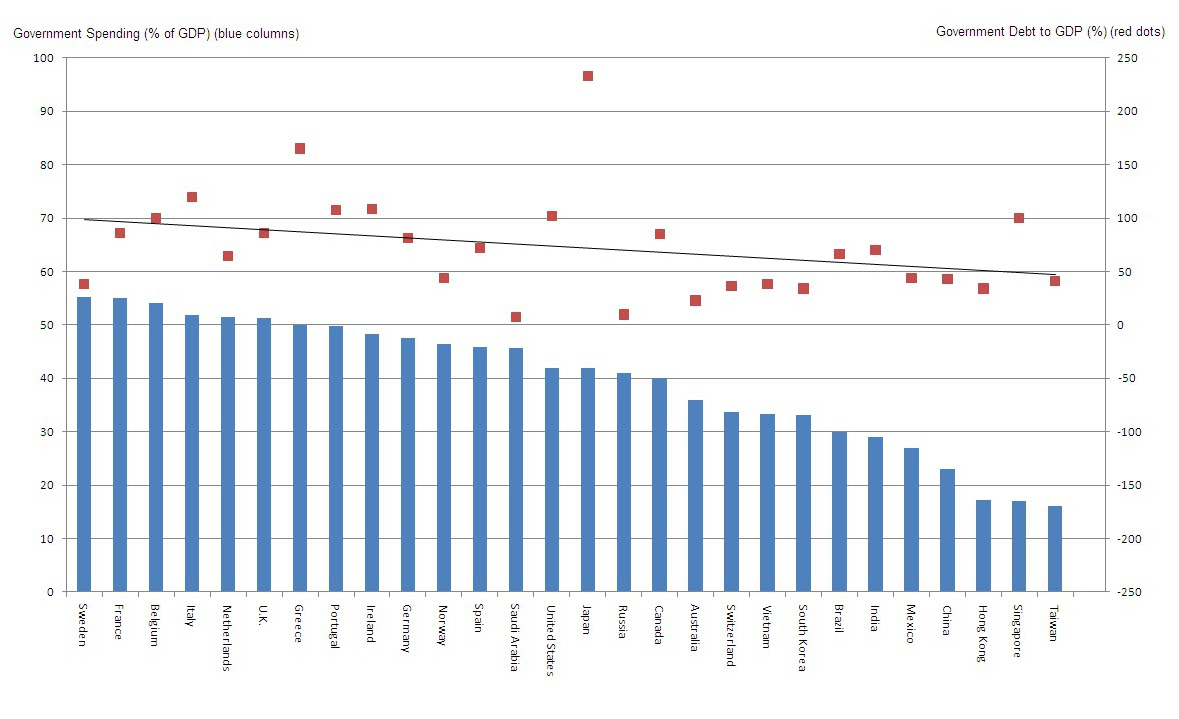 |
| Chart 3: Gov. Spending (% GDP) VS. Government Debt to GDP (%) |
Fact #3: Higher Gov’t Spending = Higher Personal Income Tax Rate
The national median income of an individual is around $US 40,000/annum. If we add the personal income tax rate to Chart 1, we get Chart 4 [below]. Again, we can see that the size of government is in direct correlation with the tax rates. This also means that the European countries (with the most government) are the ones with the highest taxes.
Higher taxation is most destructive to the private sector of the economy as it takes money from the competent people (free market capitalists) and gives it to the incompetent (government). [A notable point to make in this analysis] is that Saudi Arabia doesn’t have income tax.
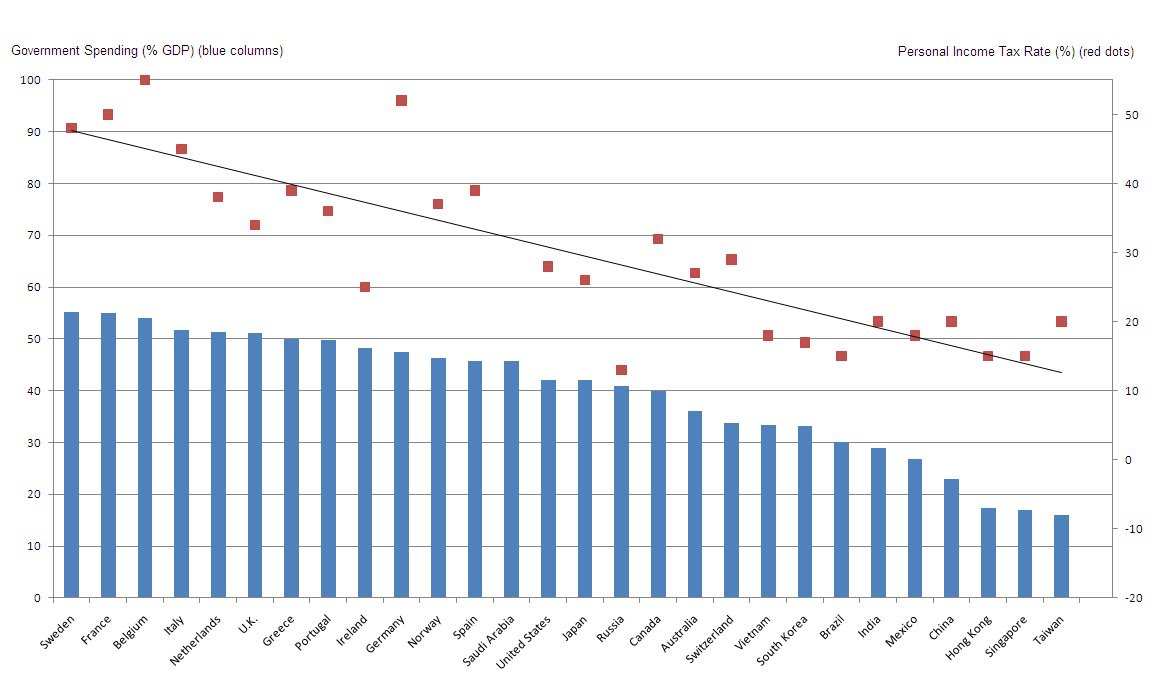 |
| Chart 4: Gov. Spending (% GDP) VS. Personal Income Tax Rate (%) |
Conclusion
[There you have it. Definitive proof that higher government involvement results in higher government spending, higher personal income taxes, higher unemployment and a weaker economy as a consequence.]
Editor’s Note: The author’s views and conclusions are unaltered and no personal comments have been included to maintain the integrity of the original article. Furthermore, the views, conclusions and any recommendations offered in this article are not to be construed as an endorsement of such by the editor.
*http://seekingalpha.com/article/675871-the-size-of-governments-and-the-effect-on-their-economies (Written by Albert Sung; Subscribe to Katchum’s macro-economic blog; Sung is also an accomplish pianist and composer as well as financial analyst. Listen to an assortment (24) of his classical compostions here.)
Register HERE for Your Daily Intelligence Report Newsletter
It’s FREE
Only the “best-of-the-best” financial, economic and investment articles posted
Edited excerpts format provides brevity & clarity for a fast & easy read
Don’t waste time searching for informative articles. We do it for you!
Register HERE and automatically receive every article posted
Recipients restricted to only 1,000 active subscribers!
“Follow Us” on twitter & “Like Us” on Facebook
Other Katchum Articles:
1. Buffett’s Measure of Stock Market Health, the TMC-to-GNP Ratio, Conveys Concerns

Buffett’s measure – the percentage of total market cap (TMC) relative to the U.S. GNP crossed 100% last week into stretched territory for the first time since 2007 which implies a mere return of around 3.3% annualized (including dividends) over the following years. [This post presents the components of the ratio and the conclusions drawn.]
2. China Continues Buying Gold Like There Was No Tomorrow! Here Are the Impressive Numbers

China continues to buy gold with both hands, keeping up all the gold they produce and importing even more! Imports were up 50% in October vs. the previous month; up 68% in November and up 74% in December. What will January bring given the continued weakness in the price of gold? Probably even more buying!
3. Get Out of the U.S. Dollar and Buy Physical Gold Before It’s Too Late – Here’s Why

Evidence suggests that the “Zero Hour Debt” line has been reached. Get out of the U.S. dollar [U.S. treasuries] and buy physical gold [or equities] before it’s too late. It is the only way to protect yourself against a massive U.S. dollar devaluation to come in the next few months. [Let me explain why that is the case.] Words: 719; Charts: 5
4. Katchum Comments on Gold, Silver & Recession

There are literally thousands of economic blogs out there and most don’t have much to offer. One exception is a blog by “Katchum” that is dedicated to monitoring breaking global economic news on a day to day basis and, as such, provides unique insights into, and analysis of, various aspects of the financial markets, commodities and the economies of the world. Below is his latest post. If you like it why not subscribe? Words: 642; Charts: 6
5. Here’s An Easy Way to Identify Gold & Gold Miner Market Tops and Bottoms

It’s amazing! Every day I learn something new. I have just come across a very powerful tool that identifies market tops and bottoms in both the gold price and the gold mining industry valuation. Let me share it with you. Words: 352; Charts: 4
6. 7 Indications That Gold & Silver Bearishness Most Likely Will Continue

This article looks at 7 reasons why gold and silver should experience further weakness over the days/weeks ahead. (Words: 206; Charts: 5)