No matter how you look at it, the U.S. dollar is very weak – very close to its all-time lows. If the value of the dollar says anything about the world’s confidence in the U.S. economy, the message is quite pessimistic. The only good thing to be said is that there is a lot of bad news that is priced into the dollar. It might be tough for things to get much worse. (Words: 1054; Charts: 7)
So says Scott Grannis, the Calafia Beach Pundit, (http://scottgrannis.blogspot.ca) in edited excerpts from his article* entitled The Dollar Is So Weak That It Might Be Good News.
Lorimer Wilson, editor of www.munKNEE.com (Your Key to Making Money!) and www.FinancialArticleSummariesToday.com (A site for sore eyes and inquisitive minds) may have edited the article below for length and clarity – see Editor’s Note at the bottom of the page. This paragraph must be included in any article re-posting to avoid copyright infringement.
Grannis goes on to say, in part:
(click to enlarge)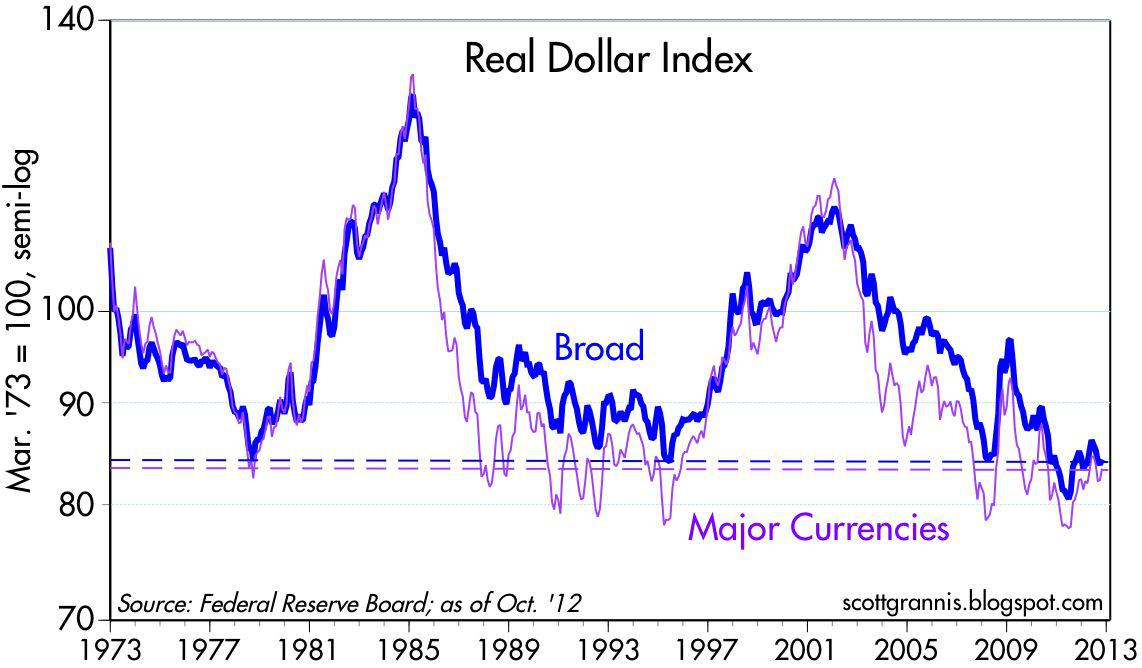
The above chart says that a U.S. dollar today buys less overseas than at almost any time in modern history. (Although the Fed’s calculation starts in 1973, in the prior decade the dollar was on average about 10% higher.) The dollar is scraping the bottom of the barrel these days, no question.
A very weak U.S. dollar is very likely the result of weak demand for dollars (relative to other currencies) combined with a generous supply.
Demand for U.S. dollars is weak because there are many causes for concern, [namely]:
- the weakest recovery ever,
- the dismal outlook for growth,
- the fiscal cliff,
- the prospects for heavier regulatory burdens (e.g., Obamacare),
- the prospect of trillion dollar deficits for as far as the eye can see [in addition to]
- the Federal Reserve monetary policy. Since the U.S. dollar’s peak in 2002, the Fed on average has been quite generous in its willingness to supply dollars, as evidenced by the length of time that real short-term interest rates have been negative.
Sign up HERE to receive munKNEE.com’s unique newsletter, Your Daily Intelligence Report
- It’s FREE
- It contains the “best of the best” financial, economic and investment articles to be found on the internet
- It’s presented in an “edited excerpts” format to provide brevity & clarity of content to ensure a fast & easy read
- Don’t waste time searching for articles worth reading. We do it for you and bring them to you each day!
- Sign up HERE and begin receiving your newsletter starting tomorrow
The charts that follow show my attempt at estimating just how weak the U.S. dollar is against individual major currencies.
The Euro is 10 – 15% Over-valued Vis-a-vis the USD
(click to enlarge)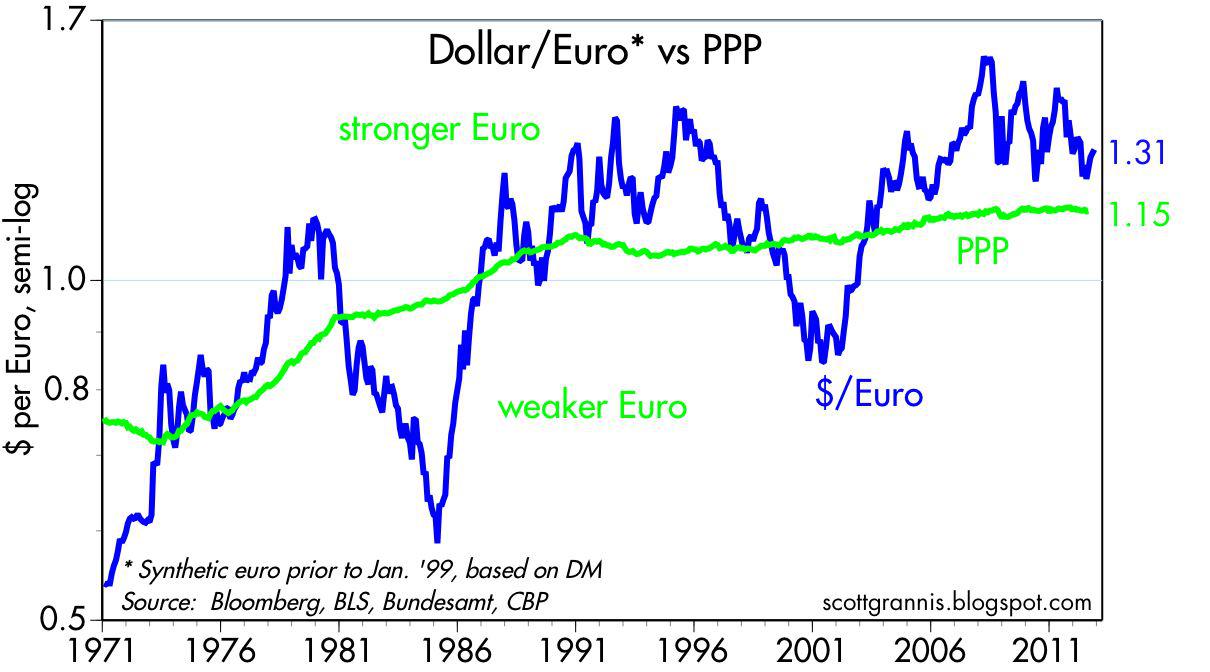
With all the problems in the Eurozone (e.g., recessions in many countries, extremely high unemployment, the threat of major sovereign defaults), and the non-negligible risk that those problems lead to the end of the Euro, it is telling that the Euro is still relatively strong – 10-15% overvalued by my calculations – as compared to the U.S. dollar. It shouldn’t be hard for the dollar to beat the euro, but it hasn’t been able to clear that very low bar.
The Japanese Yen is Over-valued by 40%
(click to enlarge)
The yen has been the strongest of all the major currencies for decades, thanks to very tight monetary policy and very low – and often negative – inflation. Recent weakness in the yen owes much to the Bank of Japan’s renewed efforts to loosen monetary policy and stop deflation. Yet the yen continues to largely shrug off the fact that Japan’s public sector deficit is still deep in double-digit territory, and the economy has posted very weak growth in recent years. Still, today the yen is only 40% overvalued against the U.S. dollar by my calculations. By comparison, it was 90% overvalued at its brief peak in 1995.
The British Pound Sterling is Over-valued by 20%
(click to enlarge)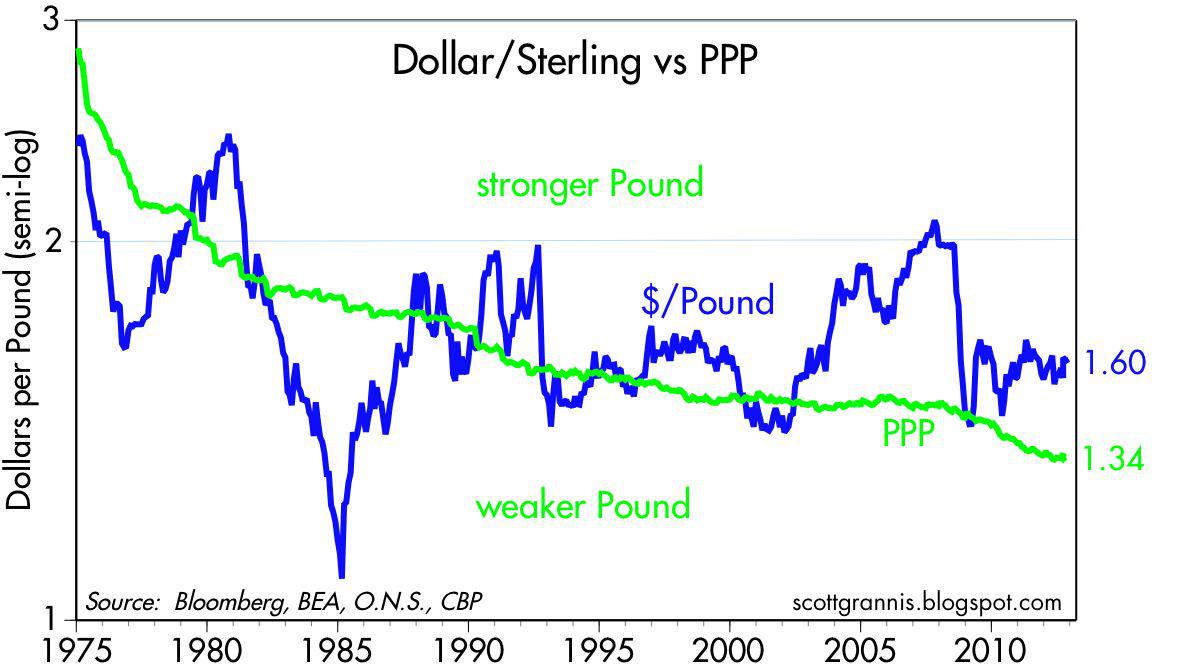
The pound remains overvalued, by about 20% according to my calculations, despite the dismal performance of the U.K. economy, worse even than that of the U.S. Real GDP in the U.K. is still 3% below its pre-recession high, and growth has been mostly nonexistent for the past two years. Moreover, industrial production has not increased at all from its recession lows. Inflation in the U.K. has averaged 4% per year for the past three years. In a word, the U.K. suffers from outright stagflation. Again, it is telling that despite these gloomy conditions, the U.S. dollar is still relatively weak against the pound.
The Canadian Dollar (Loonie) is Over-valued by 30%
(click to enlarge)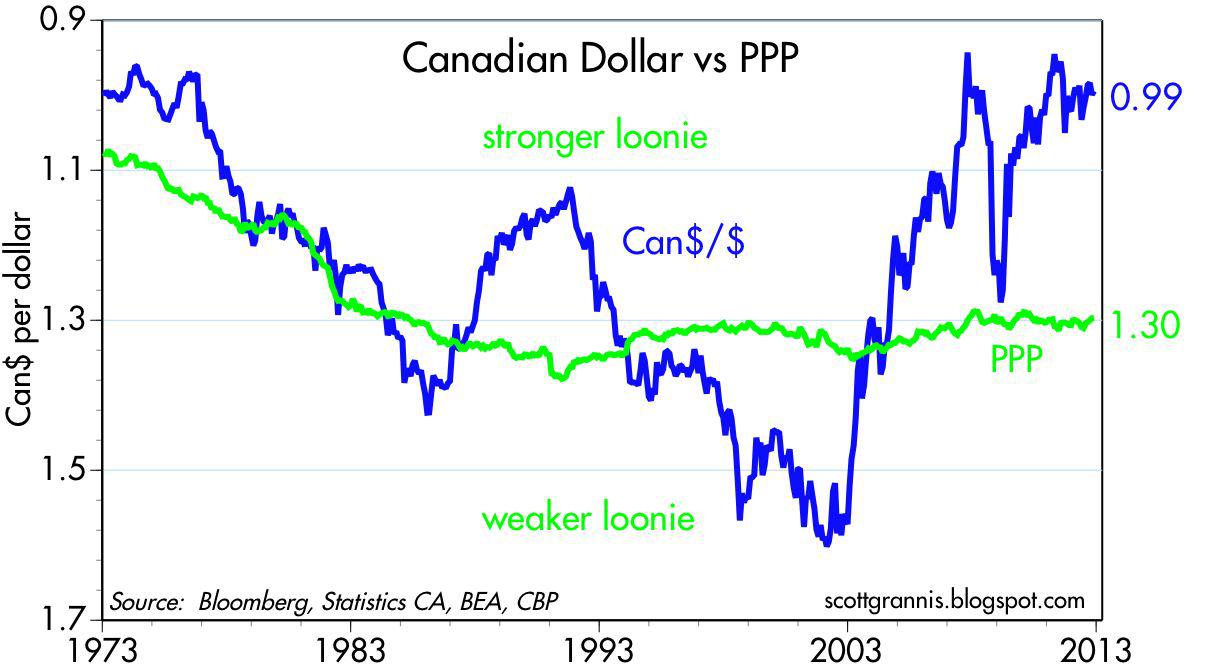
After decades of dismal performance relative to the U.S. dollar, the Canadian loonie has almost never been as strong as it is today – about 30% overvalued vis-a-vis the U.S. currency according to my calculations. Canada is riding a commodities boom, and its housing and financial markets have been much healthier than their US counterparts, thanks to the absence of housing subsidies and the relatively low level of government meddling in the housing market. Canada is even managing to reign in public sector spending, thanks to smart incentives that reward key bureaucrats for reducing spending. Stronger economic fundamentals have allowed the Bank of Canada to avoid slashing short-term rates to zero, thus giving the currency the added advantage of higher yields than can be found in the U.S..
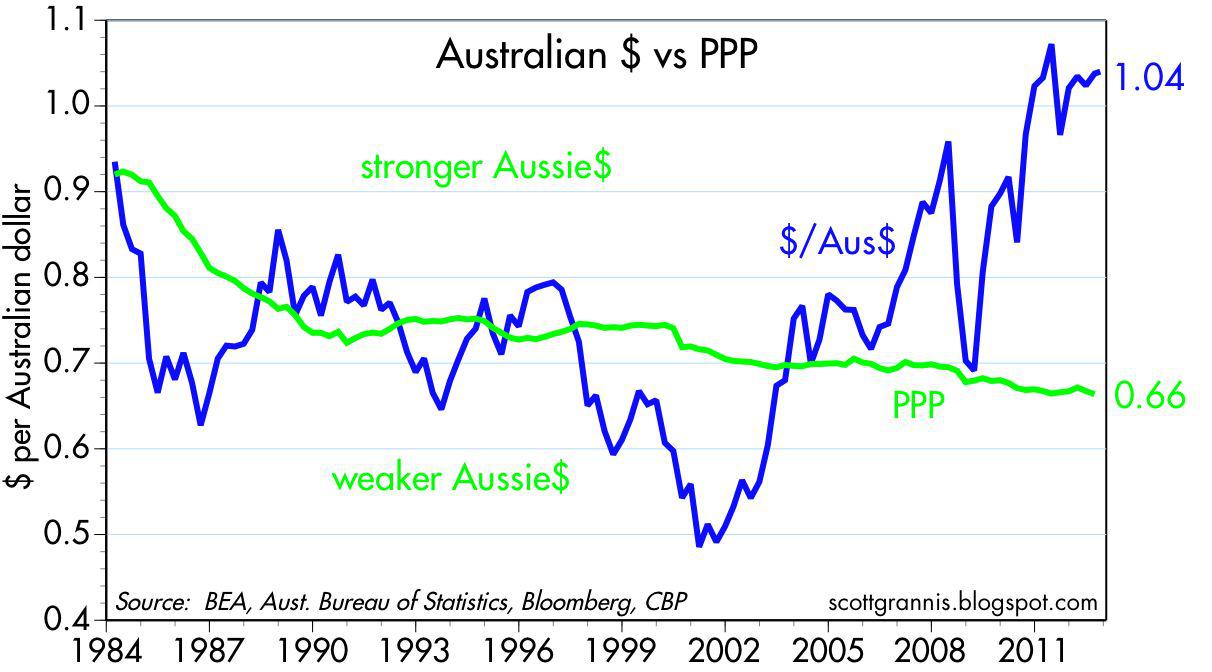
The Australian Dollar is Over-valued by 57%
Thanks largely to booming demand for its raw materials, the Australian economy has grown almost 3% per year over the past three years, and the Reserve Bank of Australia has not had the need to lower short-term rates to zero.
(click to enlarge)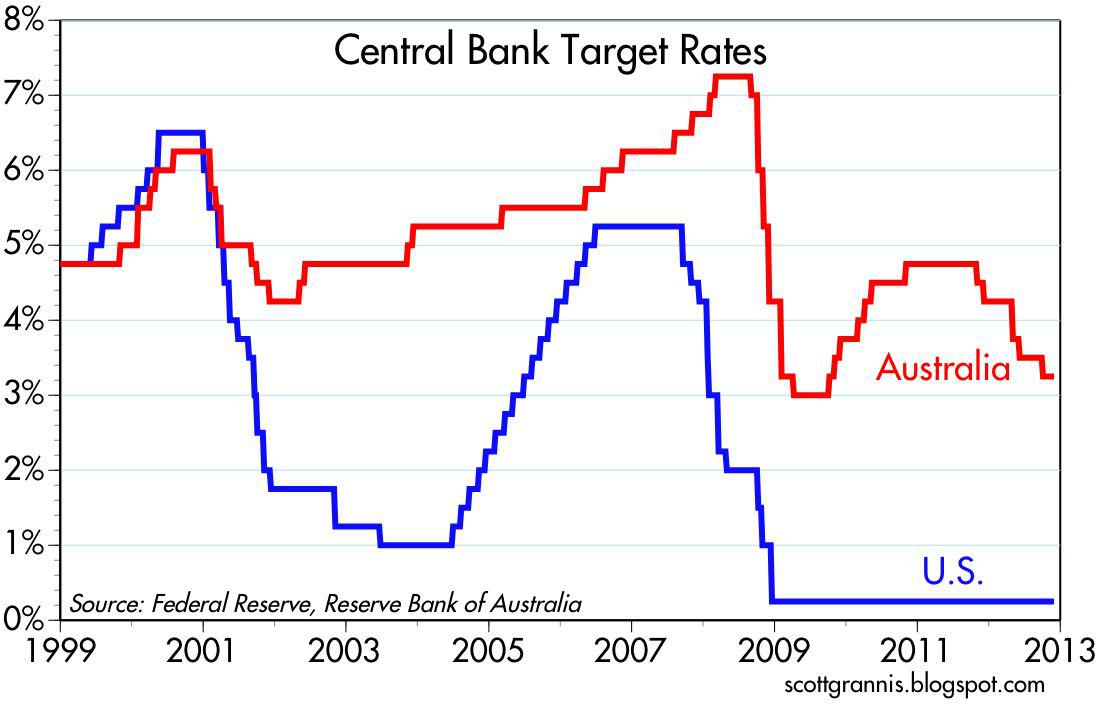
With monetary policy arguably tighter than in any country save the possible exception of Japan, and with confidence in the economy still relatively strong, it is not surprising that the Aussie dollar is almost 57% overvalued vis-a-vis the U.S. dollar – making it the strongest of all the major currencies relative to the dollar.
(click to enlarge)
Conclusion
If there is any silver lining to the dark cloud that overshadows the U.S. dollar, it is that market expectations are very pessimistic. Lots of bad news is priced in. It’s even possible that the market is braced for the news that the U.S. is going to fall off the so-called “fiscal cliff.” Although I hesitate to say it, it might even be the case that if Washington fails to come to an agreement by the end of the year, and taxes shoot up and spending sequesters kick in, the result could be less bad than is already expected….
I should add that I’m not at all optimistic that we’ll avoid the fiscal cliff…I wish I had a crystal ball but in the meantime, my only source of comfort is all the pessimism that is to be found in market prices.
*http://scottgrannis.blogspot.ca/2012/12/the-dollar-is-so-weak-that-it-might-be.html
Editor’s Note: The above posts may have been edited ([ ]), abridged (…), and reformatted (including the title, some sub-titles and bold/italics emphases) for the sake of clarity and brevity to ensure a fast and easy read. The article’s views and conclusions are unaltered and no personal comments have been included to maintain the integrity of the original article.
Related Articles:
1. Take Note: U. S. Dollar On the Verge of Falling Hard

Watch closely! The U.S. Dollar Index is within 2% of its support line…Should it break to the downside then this would suggest that a much lower U.S. Dollar is in the cards! Here’s the chart.
2. Adjust Your Portfolio Depending on the U.S. Dollar’s Next Move! Here’s Why

The election is now behind us and I pray our elected officials can come together and make quality decisions to move this country forward in a positive direction. [That being said, how the U.S. Dollar Index reacts over the short term] is going to be very important for portfolio construction in the weeks and months ahead! [Let’s take a look at what the following charts say on the subject.] Words: 225