“Follow the munKNEE” via twitter & Facebook
Dr. Marc Faber, the author and publisher of the “Gloom Boom And Doom” report is one of the most well-read economists out there. I am of the opinion that his suggestions and investment advice are more realistic than any other economist or analyst we hear and read regularly. The summary of Dr. Faber’s latest monthly report suggests that he views 2013 as a year of capital preservation. In other words, Dr. Faber is not very bullish on risky asset classes for 2013. This article discusses Dr. Faber’s views and the reasons to remain cautious in 2013. Words: 1494; Charts: 3; Tables: 1
So writes the Economics Fanatic (www.economicsfanatic.com) in edited excerpts from his post* on seeking Alpha entitled Dr. Marc Faber’s Market Outlook For 2013.
This article is presented by www.munKNEE.com (Your Key to Making Money!) and may have been edited ([ ]), abridged (…) and/or reformatted (some sub-titles and bold/italics emphases) for the sake of clarity and brevity to ensure a fast and easy read. The author’s views and conclusions are unaltered and no personal comments have been included to maintain the integrity of the original article. Please note that this paragraph must be included in any article re-posting to avoid copyright infringement.
The article goes on to say, in part:
According to Dr. Marc Faber:
That something is not quite right with the economy is evident from the recent performance of Wal-Mart, Tiffany, Genesco, and Kohl’s. What disturbs me about most asset markets is that we had outsized gains since early 2009 (there are exceptions such as Vietnamese, Chinese, Japanese, and European equities, and also US housing). In my opinion, investors’ expectations about future returns on their assets are far too optimistic. In a world that currently hardly grows investors will need to reduce their future return expectations. I believe 2013 will not be a favourable year for holders of assets. My priority has now shifted to the preservation of the outsized gains I have achieved over the last three years.
Very clearly, Dr. Faber is hinting at volatile or declining markets in 2013. It is difficult to discuss the outlook for the whole year in an environment where markets are constantly bombarded with news related to economic activity and policy action. However, one can discuss the likely trend based on the existing factors, which would impact risky asset classes in the foreseeable future.
In line with Dr. Faber’s view, I am neutral to bearish when it comes to predicting the market outlook for 2013. Before I discuss the reasons, I must emphasize here that I am not predicting any major market crash. However, it would not be surprising to see sideways markets in 2013 with a relatively high degree of volatility.
Reason #1: Corporate Earnings to Disappoint
I am of the opinion that corporate earnings will disappoint in the fourth quarter of 2012 and [that] this trend will continue into 2013.
- The U.S. economic activity remains very sluggish. This point is underscored by the fact that U.S. holiday retail sales have registered weakest sales growth since 2008. In an economy driven by consumption, this is an ominous sign.
- The eurozone is already in a recession with economic activity expected to remain gloomy in 2013.
- The growth drivers of the global economy (China and India) have also cooled down with muted economic growth for both these economies. With this scenario existing globally, it would not be surprising to see corporate earnings decline in Q4 2012.
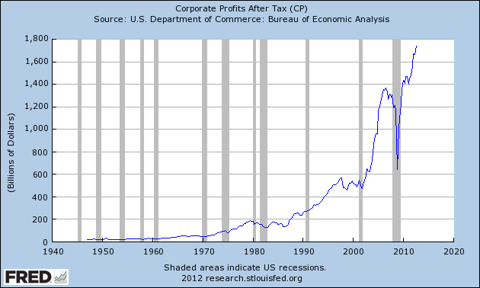
U.S. corporate profit after tax reached record high levels in Q3 2012 [see graph below]. I do expect this trend to reverse in the fourth quarter. Also, the downward earnings trend should continue over the next few quarters as there seems to be no positive upside trigger in sight for relatively robust economic activity.
Click to enlarge images.
What is very important to note here is that:
- the S&P is trading at near multiyear highs amid global gloom. Very clearly, the liquidity factor is driving equity markets higher. I am certainly not suggesting that liquidity is the only factor. However, the markets might discount more pessimism than optimism in 2013.
- The S&P 500 index is currently trading at a P/E of 16.4, which is not very far from the market P/E during peak global economic activity in 2006 and early 2007. This makes me slightly cautious considering the current global economic scenario.
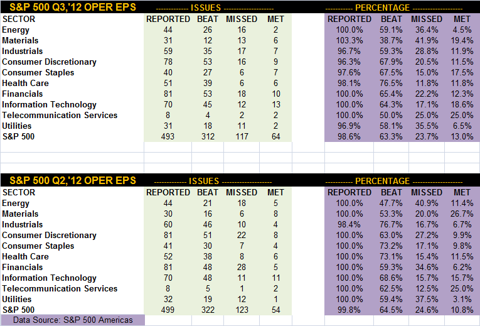
Continuing the discussion on index earnings, the table below shows that 63.3% of S&P 500 companies beat analyst estimates in the third quarter of 2012 compared to 64.5% in the second quarter of 2012.
I can say with some conviction that more companies will miss on analyst estimates in the coming quarters leading to correction in specific stocks and the broader markets. As mentioned in Dr. Faber’s summary, some stocks have already started correcting discounting relatively poor results in the foreseeable future.
Reason #2: Government Policies & Related Uncertainties
- …A clear policy outlook [would make] it easier for the private sector to plan their growth strategy but, with the fiscal cliff issue still being debated, the private sector is going slow on expansion and employment plans and, with the private sector being the economic growth driver, this will lead to relatively slower growth.
- Also, the debt ceiling issue and discussion is not far away and has the potential to make market participants nervous and rush towards safer assets. It must be noted here that the last time the debt ceiling issue escalated, consumer confidence dipped to its lowest in a non-recessionary period. Therefore, the issue should not be ignored by market participants.
As mentioned earlier, the continued failure of expansionary monetary policies to impact the real economy might trigger a negative reaction from equity markets sometime in 2013.
Readers might argue that the U.S. is not in a recession and headline unemployment numbers are improving [and,] as such, government policies are working. However, I would look at indicators such as the velocity of money and the U6 rate to determine the real state of the economy.
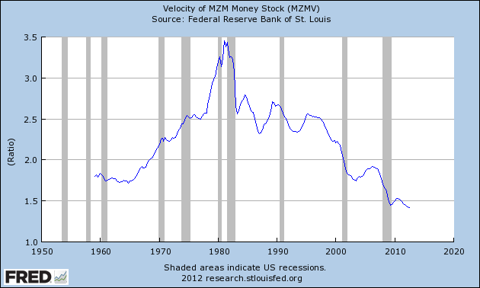
- The money velocity continues to slump and is at its lowest levels in the last 50 years [see the first chart below].
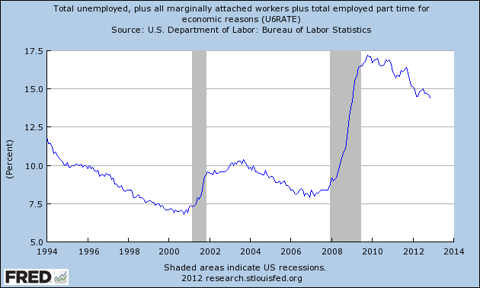
- At the same time, the U6 unemployment rate remains uncomfortably high at 14.4% [see the second chart below].
These critical factors do make me believe that all is not well with the economy and the markets will react sooner or later to the real economic gloom.
Conclusion
Dr. Faber’s view might be right for 2013 and investors do need to focus on capital preservation. Also, trading might not be a good idea as markets can exhibit a high degree of volatility amidst economic and policy uncertainty.
In line with this view, I would consider the following investments for 2013:
- SPDR Gold Shares ETF (GLD): I maintain [the] view…[that] investors…[should] consider exposure to the hard asset for the long term. In the near term, some more correction in the precious metal is entirely likely. However, expansionary monetary policies, artificially low interest rates and demand from Asian central banks will trigger long-term upside in the precious metal. The GLD ETF seeks to replicate the performance, net of expenses, of the price of gold bullion.
- iShares Silver Trust ETF (SLV): Very similar to the argument for gold, I am also bullish on silver for the long term. Investors can consider exposure to silver through the purchase of physical metal or the ETF, which seeks to reflect the price of silver owned by the trust, less the trust’s expenses and liabilities.
- Vanguard Consumer Staples ETF (VDC): Seeking a relatively defensive sector, I would consider exposure to VDC. The ETF seeks to track the performance of a benchmark index that measures the investment return of stocks in the consumer staples sector. The ETF has a low expense ratio of 0.19%. In terms of sub sector exposure within the consumer staples sector, the ETF has 19% exposure to the household segment, a 17.8% exposure to soft drinks segment, a 16.6% exposure to the packaged foods & meats segment, and a 16% exposure to the tobacco segment.
- Vanguard Health Care ETF (VHT): The healthcare sector is also a relatively low beta sector and less prone to economic shocks. The VHT ETF seeks to track the performance of a benchmark index that measures the investment return of stocks in the healthcare sector. The ETF also has an expense ratio of 0.19%. In terms of sub sector exposure within the healthcare sector, the ETF has 45% exposure to the pharmaceuticals segment, a 16% exposure to the biotechnology segment, a 14.9% exposure to the healthcare equipment segment, and a 7.3% exposure to managed healthcare.
- Johnson & Johnson (JNJ): This is a good investment option. I like this highly diversified healthcare company, with products as well as regional diversification. Further, the sector catered to by JNJ is not very prone to economic shocks. JNJ has been a good dividend payer in the past, with a dividend yield of 3.5%. In my opinion, the stock is excellent for the long-term portfolio as well. It also commands a higher rating than the U.S. sovereign rating.
- SPDR S&P 500 ETF (SPY): It has been proven that beating the index is not an easy task. Therefore, the strategy should be simple — beat the index or invest in the index. From this perspective, SPY looks interesting on any meaningful correction in 2013. The ETF provides investment results that, before expenses, generally correspond to the price and yield performance of the S&P 500 Index.
Sign up HERE to receive munKNEE.com’s unique newsletter, Your Daily Intelligence Report
- FREE
- The “best of the best” financial, economic and investment articles to be found on the internet
- An “edited excerpts” format to provide brevity & clarity to ensure a fast & easy read
- Don’t waste time searching for articles worth reading. We do it for you!
- Sign up HERE and begin receiving your newsletter starting tomorrow
- You can also “follow the munKNEE” via twitter & Facebook
* http://seekingalpha.com/article/1086011-dr-marc-faber-s-market-outlook-for-2013
Related Articles:
1. Investors, Get Fully Invested! S&P 500 On Verge of Entering Euphoria Stage of Cyclical Bull Market
[In spite of all that is seemingly wrong with the U.S. economy] I think we are on the verge of entering the euphoria stage of this cyclical bull market where traders become convinced that QE3 is a magic elexir with no unintended consequesnces. [As such,] I see a strong acceleration and a significant and sustained breakout above the S&P 500 September high of 1475. (Words: 264 + 3 charts)
2. Dr. Nu Yu’s Update on the S&P 500′s Developing “Three Peaks and a Domed House” Pattern
[In spite of the fact that my proprietary] Leading-Wave Index does not support the current general bearish market sentiment the broad market is testing whether it has reached the “First Floor” phase of the speculated “Three Peaks and a Domed House” pattern. A consolidation is expected in the “First Floor” phase. Any significant directional movement could be washed out this week by the expectations of both the “Santa Claus Rally” and the “Fiscal Cliff”. [Below are charts to illustrate exactly where the S&P 500 is in this “Three Peaks and a Domed House” pattern. Most interesting!] Words: 463; Charts: 2
3. Here’s Another Clue to Future Direction of S&P 500
4. Shiller & Siegel Forecasts of Future Real Stock Market Returns Differ Considerably

5. Don’t Ignore This Fact: “Greedometer Gauge” Signals S&P 500 Drop to the 500s by July-August, 2013!


6. Current Market Overvaluation (from 33% – 51%!) Suggests Cautious Long-term Outlook


7. Goldman Sachs: The Fiscal Cliff Is a Real & Present Danger to Future Level of S&P 500 – Here’s Why


9. Consumer Discretionary Stock Performance Key to Market Direction – Here’s Why


10. Harry Dent Sees Dow 3,000; Seth Masters Sees Dow 20,000! Who’s Most Likely Right?


11. BMO: We’re On the Verge of the Next Bull Market! Here’s Why


12. Dow 20,000 (and 2,000 for the S&P 500) Likely Within 5-10 Years! Here’s Why


13. Jeremy Siegel: 50% Chance of Dow Reaching 17,500 By The End Of 2013! Here’s Why


14. Prepare to Be Nickled & Dimed to Death in the Stock Market Until 2015! Here’s Why

 munKNEE.com Your Key to Making Money


