The U.S. economy is careening toward a fiscal cliff. Europe is stuck in a financial abyss. China is economy, a bastion of strength for the last decade, is throttling down. Given this less-than-rosy economic backdrop, how could I possibly predict that U.S. stocks are poised to rally as 2012 comes to a close? Glad you asked….Here are 10 reasons why I’m taking such a contrarian stance. (Hint: I saved the most important reasons for last). Words: 1420
So says Lou Basenese (www.wallstreetdaily.com) in edited excerpts from his most recent 2 articles* entitled Charts: 10 Reasons To Expect A Year-End Stock Rally (Part 1 and Part 2).
Lorimer Wilson, editor of www.FinancialArticleSummariesToday.com (A site for sore eyes and inquisitive minds) and www.munKNEE.com (Your Key to Making Money!), has edited the article below for length and clarity – see Editor’s Note at the bottom of the page. This paragraph must be included in any article re-posting to avoid copyright infringement.
Basenese goes on to say, in part:
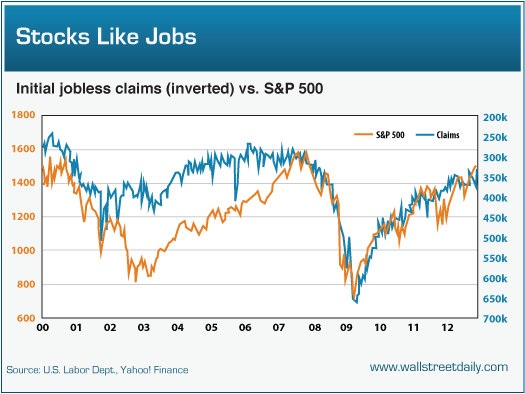
#1: The Inverse to Joblessness is …
Higher stock prices and, of course, more jobs. A strong correlation exists between stock prices and the four-week moving average of initial jobless claims. As claims fall, stock prices rise and claims keep falling.
The latest jobs reports put the average at 368,000 claims, compared to slightly north of 400,000 a year ago. Over that period, stocks are up 14.3%.
 (Click to enlarge)
Between now and the end of the year, the labor market is expected to continue improving so, as claims keep falling, stocks should keep rallying.
#2: On the Brink of Economic Disaster? Hardly!
Third quarter GDP growth came in well ahead of expectations at 2%. While that’s below the historical norm, it’s a step in a positive direction and all signs point to even more positive surprises.
Retail sales, for instance, increased for the third consecutive month. That’s a trend, not an anomaly and, since the consumer is a major driver of economic activity, an upbeat consumer is good for the stock market.
Retail sales aren’t the only bright spot, though. Consider Bespoke Investment Group’s Economic Diffusion Index. It tracks the rolling number of economic data reports that come in better than expected versus worse than expected over the last 50 days and it currently stands at +17. That’s the highest reading since March 2011 – and a sharp reversal from the late summer readings.
 (Click to enlarge)
As Bespoke says, “Either investors are not giving the economy the credit it is due, or they’re simply ignoring it.” Either way, investors will eventually wake up to the reality that we’re not headed for another recession, which will go a long way to ease their fears about investing in stocks. Speaking of which …
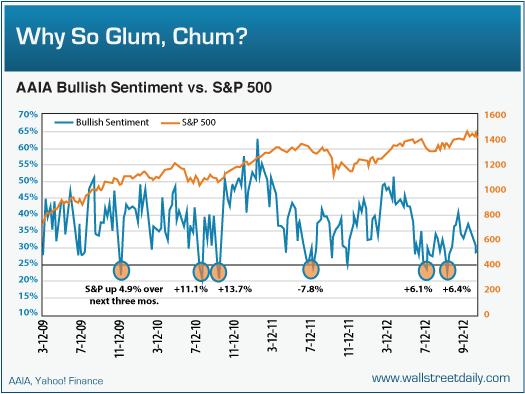
#3: Terrible Expectations
Individual investors are notoriously terrible market timers. They fall in love with stocks before collapses and swear off stocks before – and during – rallies. Accordingly, we should treat individual investor sentiment as a contrarian indicator and, right now, it’s close to flashing a neon “Buy” signal.
 (Click to enlarge)
Last week, the American Association of Individual Investors’ (AAII) bullish sentiment reading checked in at 29.22%. That’s well below the long-term average of 38.85% since 1987 and it’s also within spitting distance of the key 25% level. As you can see on the chart, five out of six times that bullish sentiment dropped below 25% during the current bull market, stocks rallied over the next three months – by an average of 5.7%.
Therefore, given investors’ increasingly pessimistic outlook, we should be increasingly optimistic. It’s counterintuitive, but it’s true.
#4: The Party’s Not Over Till the Cops Get Called
If you’re one of those people who refuse to put too much stock into sentiment readings, I’ve got news for you: Investors’ latest actions lead to the same bullish conclusion.
The time to leave a party is when it gets overcrowded…[and] the only party that’s overcrowded is the bond party.
 (Click to enlarge)
Since the market bottom:
- investors have plowed $1 trillion into bonds…[posting the] biggest inflow on record during the week ending October 24 [while]
- investors have yanked a net $138 billion out of mutual funds and ETFs that invest in U.S. stocks…[with] redemptions from U.S. equity funds hitting their highest level in 49 weeks.
Conclusion: with investors still piling into bonds and shunning stocks, it’s time for us to cue up some Prince and dance like it’s 1999 because the stock party’s not even close to ending yet.
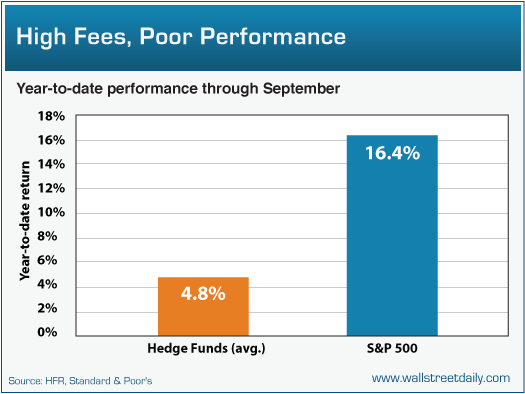
#5: Failure is Not an Option
Individuals aren’t the only ones dramatically underweighted to equities….The average hedge fund’s net long exposure checks in at 42%, down from 49% in the second quarter and it continues to hurt their performance.
 (Click to enlarge)
According to hedge fund tracker, HFR, the average hedge fund is only up 4.8% in 2012, net of fees. That compares to a 16.4% return for the S&P 500 over the same period. As Barron’s Joseph Checkler points out, “Hedge funds typically lag behind broader indexes slightly during years with double-digit S&P gains…but it’s rarely by this much.”
Eventually, hedge funds are going to have to rotate into stocks in a meaningful way just to keep up and, when they do, it should naturally boost prices otherwise investors aren’t going to keep paying high hedge fund fees. If they want to underperform the market year-in and year-out, they can hire mutual fund managers to do it for a lot less. Just saying.
#6: A November to Remember
Next to April, November’s the best month of the year for stocks over the last 20 years. In November the Dow puts up positive gains 70% of the time – with the average gain checking-in at 2.03%, according to Bespoke Investment Group.
(click to enlarge)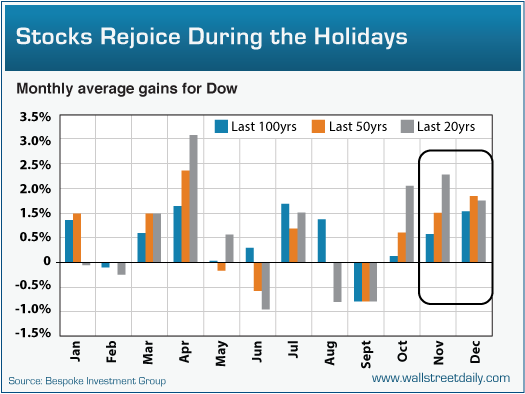
The performance over the last 50 years and 100 years isn’t anything to bemoan, either. The market was up 60% and 62% of the time, respectively, for average gains of 0.66% and 1.17%.
While historical gains in December aren’t as strong, the percentage of time that the Dow rallies is stronger. Over the last 20, 50 and 100 years, stocks rallied in December 70%, 68% and 73% of the time, respectively. Seasonality is not always accurate but is it instructive and relevant.
#7: Presidential Election Years
Stocks have a penchant for rallying during presidential election years and so far this year, stocks are sticking to the script….
(click to enlarge)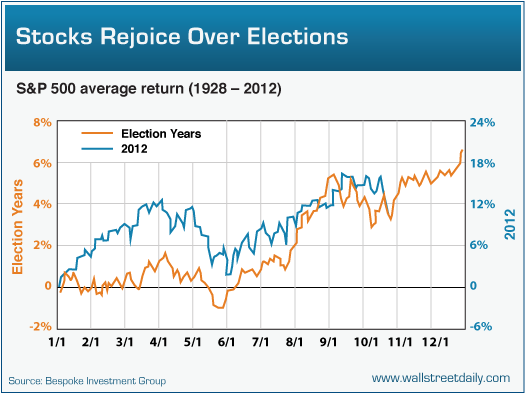
With history as our guide, the rest of the election year should be full of celebration – at least for investors.
#8: The End of Uncertainty
[With the election over the]…enormous uncertainty weighing on the market [will have] lifted…Such uncertainty has been holding back stocks and businesses. Non-financial companies have been clinging to a stunning $1.7 trillion in cash….but once executives know the leader – and the policies – that are going to be in place during the next presidential term, you can bet they’ll start investing (and hiring) again.Save time: Just read the “Best of the Best” articles!
– Sign up here to have all newly posted articles delivered automatically to your inbox
– It’s FREE and includes an “easy unsubscribe feature” should you decide to do so at any time
– All articles are carefully selected and posted in edited form for the sake of clarity and brevity to ensure a fast and easy read
– Don’t delay – sign up here – now!
The end of the election also means Congress can get to work eliminating the uncertainty surrounding the Fiscal Cliff. A compromise (which is the only option) would be enormously bullish for equities…and, as Ed Yardeni, President of Yardeni Research, said about a compromise, “Instead of falling off a cliff, there would be a Second Recovery for the U.S. economy led by housing and autos.”
#9: From Hindrance to Help
The housing market contributed mightily to the last economic and stock market collapse. Now, it’s starting to contribute to the recovery. Take a look at this chart from the economists over at Goldman Sachs.
(click to enlarge)
As you can see, housing’s contribution to GDP is transitioning from a huge hindrance to a huge help to the overall economy.
Goldman estimates that direct residential investment growth alone “will accelerate from 10.4% year-on-year in 2012 Q2 to 13%” by the end of 2013. Add in the “wealth effect” from increases in home prices, and we’re talking about a half-point contribution to GDP growth. That might not seem like a lot but it actually translates into a 25% increase to the current GDP growth rate. In my opinion, that’s on the conservative side. Either way, it’s a net positive for the stock market.
#10: The (Investment) Theory of Relativity
In terms of relativity, stocks represent an investor’s best choice. Cash yields nothing and Treasuries don’t either.
(click to enlarge)
In fact, Treasury bonds are bid up so high that the S&P 500 Index yields more (2.13% versus 1.72%) and that’s an extremely rare occurrence. Truth is, it’s only happened about 20 times on a quarter-over-quarter basis in the last 60 years and each time, the S&P 500 rose by double digits over the next year.
Bottom line: Stocks are the only bargain in town and although the S&P 500 Index has more than doubled in price since the 2009 bottom, stocks remain cheap at just 14.28 times earnings.
Keep in mind, when the stock market peaked in 2000, the S&P 500 traded for 35 times earnings. We’re nowhere close to that level. A simple rally back to the long-term average price-to-earnings multiple implies a double-digit upside. I’d hate for you to miss out.”
* Source of Part 1: http://www.wallstreetdaily.com/2012/11/01/charts-10-reasons-to-expect-a-year-end-stock-rally-part-1/
Source of Part 2: http://www.wallstreetdaily.com/2012/11/02/charts-10-reasons-to-expect-a-year-end-stock-rally-part-2/
Editor’s Note: The above post may have been edited ([ ]), abridged (…), and reformatted (including the title, some sub-titles and bold/italics emphases) for the sake of clarity and brevity to ensure a fast and easy read. The article’s views and conclusions are unaltered and no personal comments have been included to maintain the integrity of the original article.
Related Articles:
1. Don’t Ignore This Fact: “Greedometer Gauge” Signals S&P 500 Drop to the 500s by July-August, 2013!

The S&P500 is likely to achieve a secular (long term) peak this month, then drop to the 500s by July-August 2013. This article explains why. Words: 180
2. A Massive Stock Market Crash Is Coming!

In the financial world, the month of October is synonymous with stock market crashes. So will a massive stock market crash happen this year? You never know. Hopefully we’ll get through October (and the rest of this year) but, without a doubt, one is coming at some point. The truth of the matter is that our financial system is even more vulnerable than it was back in 2008 and, as such, many financial experts are warning that the next crash is rapidly approaching and that those on the wrong end of the coming crash are going to be absolutely wiped out. Let’s take a look at some of the financial experts that are predicting really bad things for our financial markets in the months ahead. Words: 1634
3. Current Market Overvaluation (from 33% – 51%!) Suggests Cautious Long-term Outlook

Based on the latest S&P 500 monthly data, [my analyses indicate that] the market is overvalued somewhere in the range of 33% to 51%, depending on which of 4 indicators I used. This is an increase over the previous month’s 31% to 48% range. [Let me explain the details.] Words: 475
4. Goldman Sachs: The Fiscal Cliff Is a Real & Present Danger to Future Level of S&P 500 – Here’s Why

“Portfolio managers have been swayed by hope over experience” when it comes to anticipating the effects the fiscal cliff will have on markets. Investors aren’t giving as much attention to the fiscal cliff as they should be, and that may be helping to set the markets up for a repeat of last year, when the debt ceiling negotiations sent stocks plummeting.
5. I’m Worried About the Likelihood of a Sharp Market Decline This Fall – For These Reasons

Back in April and May, it looked like the economy was falling apart, the euro was going to come unglued, and stocks were going to plunge. Sentiment was extremely bearish and volatility was jumping. Now in August, you can’t find a bear anywhere on Wall Street! Me? I continue to be worried about the likelihood of a sharp market decline this fall for several reasons which I share with you below. Words: 495
6. These 6 Factors Suggest Avoiding Equities in the Foreseeable Future

The six factors discussed in this article suggest a near-term peak for equity markets, avoiding fresh exposure to equities at these levels and selling some of one’s equity holdings. Long-term investors can still ignore the volatility and buy quality stocks, however, it would make more sense to buy the same stocks after the markets decline 10%-15% than buying it at current levels. [Let me explain more fully.] Words: 665
7. Consumer Discretionary Stock Performance Key to Market Direction – Here’s Why
Renewed leadership by the sectors that stand to benefit most from a stronger economy and profit growth down the road…could be one of the best indications that perhaps the worst is indeed behind us and the rally has more room to run. However, if these cyclical sectors fail to participate more fully, that would be a signal of more potential trouble ahead. [Let me explain.] Words: 840
8. Harry Dent Sees Dow 3,000; Seth Masters Sees Dow 20,000! Who’s Most Likely Right?

Harry Dent, the financial newsletter writer and CEO of economic forecasting firm HS Dent, has one of the most bearish calls on stocks we’ve heard in a while. Appearing on CNBC yesterday, Dent explained the demographics-driven thesis behind his Dow 3000 call.