Unless the S&P 500 rebounds and stays above 1250-1260, the recent 10% drop in the index may well be an indication that the markets have capitulated and a signal of the beginning of a renewed severe downturn. Words: 752
“Head-and-Shoulders” Reversal Pattern Suggests Beginning of a Renewed Downturn
Forming a large Head-and-Shoulders reversal pattern since the beginning of 2011, the S&P 500, Dow Jones Industrial Average, and many other market sectors and stocks may have just capitulated signaling the beginning of a renewed downturn.
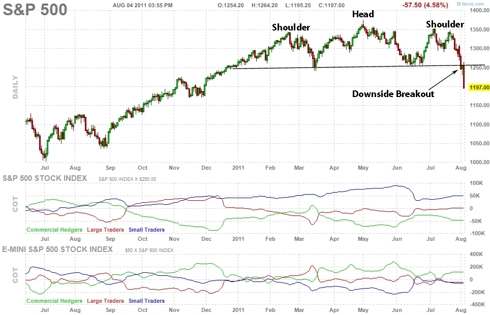
Head and Shoulders patterns are usually seen at stock market peaks following significant price increases. A downside breakout from the pattern marks the beginning of a steep drop that may not be recovered for some time. Unless the market rebounds and stays above 1250-1260, expect the drop to continue.
Up-leg Since March 2009 May Have Been Just a “Dead Cat Bounce”
To make matters worse, our current “bull” market which has propelled the stock market up over 100 percent from the 2009 bottom may be just an illusion. Instead, our 2+ year recovery may have just been a “dead cat bounce” before the next, and much steeper market decline.
Current Market Performance Similar to the Great Depression
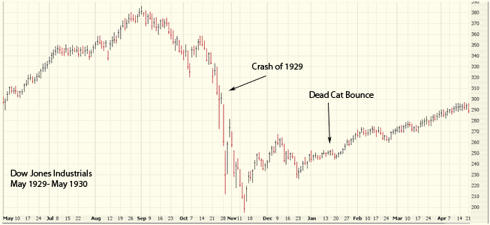
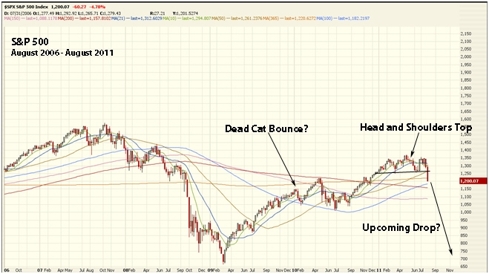
In fact, our market since the 2007 top is eerily similar to the market of the Great Depression:
Dow Jones, 1929-1930
S&P 500, 2006-2011
The Crash of 1929 was nothing compared to the Great Depression that ensued. The “dead cat bounce” from November 1929 to May 1930 was just a temporary pause and trap before the next drop. If our current market from 2006 to 2011 is anything like the market preceding the Great Depression, we may be setting up for a huge upcoming recession.
Head and Shoulders tops the “dead cat bounce” of 1929-1930 before the Great Depression: 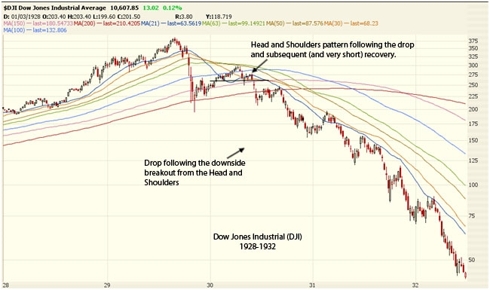
(Click to enlarge)
I’d prefer not to be such a doomsayer, but with our market currently behaving so similarly to that of the Great Depression, I can’t help but at least present the possibilities.
Stock Market Euphoria a Set-up for a Down Market
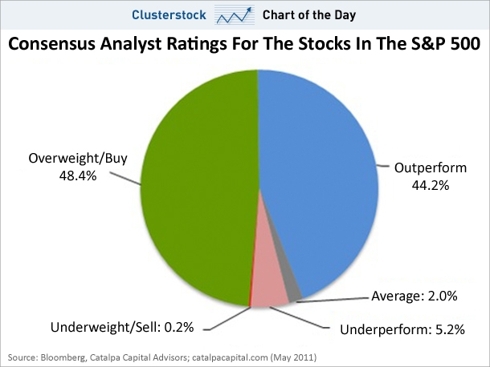
A compelling piece of evidence that the market is full of euphoria – over 90 percent of analyst ratings were “buy” or “outperform.” This decisive number of bullish analyst opinion undoubtedly spurs extra excitement and optimism among investors, which in turn results in increased buying, until the point where buyers run out or reality sets in. When over 90 percent of analysts prepare for a well-performing market, investors should prepare for the worst-performing market.
Gold Will Not Offer Any Protection
If those analysts are right – and the market continues to rise – gold will fall because the fear in the markets will subside and economies will get back on track. More likely, however, markets will fall and gold will follow. Gold will not be able to fulfill its role as a safe haven; it will fall together with a dropping market. Its failure to act as protection, as people had hoped, will cause them to sell gold.
How to Protect Your Money
The market will likely bounce back for a few days as selling takes a breather but this may just be a pullback in price before the next much steeper drop. Protect your money by selling some stocks after this bounce.
*http://seekingalpha.com/article/285061-has-the-500-point-drop-confirmed-a-great-depression-2-0?source=email_macro_view
Related Articles:
- Dow Theory Signals New Bear Market is Imminent https://www.munknee.com/2011/08/dow-theory-signals-new-bear-market-is-imminent/
- This Pattern Suggests Stock Market Crash Coming in the Fall https://www.munknee.com/2011/08/this-pattern-suggests-stock-market-crash-coming-in-the-fall/
- The S&P 500 is Highly Vulnerable – Here’s Why https://www.munknee.com/2011/08/the-sp-500-is-highly-vulnerable-heres-why/
- Market Crash Will Hit By Christmas 2011! Here’s Why https://www.munknee.com/2011/07/the-sp-500-is-worth-only-910-get-out-or-lose-big/
- S&P 500 Likely To Top Out at 1400 – 1500 & Then Topple to 400! Here’s Why https://www.munknee.com/2011/02/uncanny-relationship-with-nikkei-1929-crash-suggests-sp-500-about-to-top-out-and-then-tumble/
- Stock Market is Due for a 15-20% Correction – Here’s Why https://www.munknee.com/2011/06/stock-market-is-due-for-a-15-20-correction-heres-why/
- A Violent Correction Is Coming For the S&P 500! Here’s Why https://www.munknee.com/2011/06/a-violent-correction-is-coming-for-the-sp-500-heres-why/
- Why a Major Stock Market Correction is Imminent https://www.munknee.com/2011/05/why-and-how-best-to-play-a-major-stock-market-correction-is-imminent/
- S&P 500 is 45% Overvalued According to Reversion to Mean Analysis! https://www.munknee.com/2011/01/these-2-historical-charts-show-how-high-then-how-low-the-sp-500-might-go/
- How Mean Will the S&P 500′s Future Regression to Trend Be? https://www.munknee.com/2011/01/how-mean-will-the-sp-500s-future-regression-to-trend-be/
Editor’s Note:
– The above article consists of reformatted edited excerpts from the original for the sake of brevity, clarity and to ensure a fast and easy read. The author’s views and conclusions are unaltered.
– Permission to reprint in whole or in part is gladly granted, provided full credit is given as per paragraph 2 above
 munKNEE.com Your Key to Making Money
