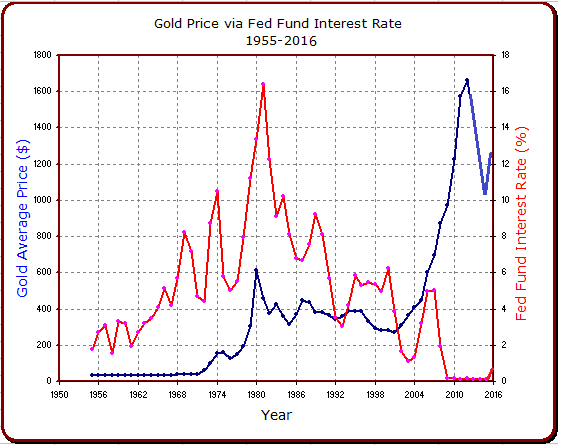
Data from over 60 years of history has never shown that an increased  interest rate will result in lower gold prices (see chart below). Gold prices and interest rates are in positive correlation most of the time and when they move in opposite direction, it is gold up and interest rates down. Of course, past performance can never be used to predict future performance but it is my view that the 3 1/2 year gold price down-cycle has finally ended and I am very bullish on it’s long-term prospect…
…The official U.S. Government gold price changed only four times from 1792 to the present. Starting at $19.75 per troy ounce in 1792, raised to $20.67 in 1834, and $35 in 1934. In 1972, the price was raised to $38 and then to $42.22 in 1973. A two-tiered pricing system was created in 1968, and the market price for gold has been free to fluctuate since then.
Let us take a closer look of the above chart: Gold prices started really moving, either up or down, from 1971.
- 1971 – 1974: Gold prices moved up from $40.62 to $154.00. At the same time, the Fed Fund interest rate moved up from 4.67% to 10.51%.
- 1976 – 1981: Gold prices ran up from $124.74 to $615.00 while the Fed Fund interest rate skyrocketed from 5.05% to 13.35%.1981 – 1999: This is the big down cycle for both gold prices and the Fed Fund interest rate. Gold prices dropped from $460 to $278 and the Fed Fund interest rate pulled back from 16.39% to 4.97%.
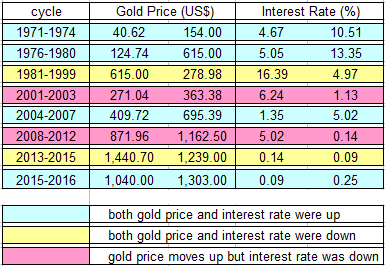
- 2001 – 2003: This is the period that gold prices moved up while interest rate pulled back further. Gold prices jumped from $271.04 to $363.38 while interest rates dropped from 3.88% to 1.13%.
- 2004 – 2007: The third time that both gold prices and interest rates moved up together. Gold prices ran up from $409.72 to $695.39 while interest rates increased from 1.35% to 5.02%.
- 2008-2012: This is the second time that gold prices and interest rates moved in opposite directions. While gold prices made a big move from $871.96 to $1,662.50, interest rates dropped from 1.92% to 0.14%.
- 2013 – 2015: This is the fourth time that both gold prices and interest rates dropped. While gold prices pulled back from $1,662.50 to $1,040.00, interest rates dropped from a then historical low of 0.14% to almost zero.
- 2015 – 2016: The Fed raised its Fund interest rate for the first time in nine years at the end of last December and gold prices responded. It gained more than 20% from 1,040 to 1,302 high in a few months.
The table below shows the correlations between the price of gold and the Fed Fund interest rate over the years:
…[The above chart shows that:]
- gold prices and interest rates are in positive correlation most of the time. When they move in opposite direction, it is gold up and interest rates down.
- Data from over 60 years of history has never shown that an increased interest rate will result in lower gold prices.
Of course past performance can never be used to predict future performance but it is my view that the 3 1/2 year gold price down-cycle has finally ended.
Other Forces Behind Gold Price Movement
- Whenever the market crashes or bad US economic news comes out, gold prices move higher. This is because investors will sell stocks and buy into gold as a safe haven – but the opposite is not always true.
- A strong US dollar also tends to bring gold prices down – but this is not always true. It is particularly true that during the inflationary period, both the US dollar and gold prices will fly high as the dollar will be worth much less then.
- …Most times gold prices moved lower before Fed meetings and spiked high after no interest rate hike was announced – but a few weeks later, the gold price will always give up all the short term gains and set new lows.
Near Term Gold Direction
Gold has gone through two phases this year so far and is under phase three now.
- Phase I: January 1 – March 10, uptrend run.
- Gold ran from 1,060 to 1,287, gained 21.40%. The reason behind the big and quick run:
- Fed Fund interest rate raise first time in nine years — hint for possible inflation.
- Market crash — due to the fear of US economic slowdown and poor corporate earnings – but market started its recovery since February 11 low, and gold kept running until March 10.
- Gold ran from 1,060 to 1,287, gained 21.40%. The reason behind the big and quick run:
- Phase II: March 10 – May 2, consolidation and break out.
- Gold price was in almost two months of consolidation and broke out of its March 10 high on heavy volume to set up a new year high of 1,302 on May
- The news which ignited the gold break out was that US Q1 GDP was revised down to annual growth of 0.5%.
- Phase III: From May 2 to May 19, three weeks so far and may last longer, pull back.
- Normal profit taking and no one knows for sure how long and how deep the pull back will be – but I believe that the pull back will not bring the gold price down to below 1,230.
The following is the 8-month gold daily chart.
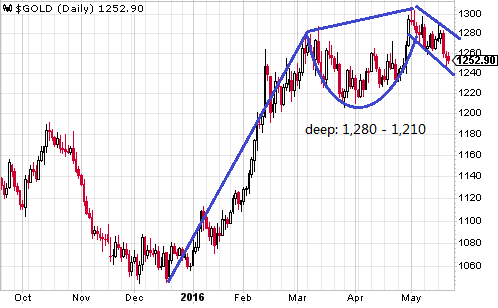
…”As its name implies, there are two parts to the pattern: the cup and the handle. The cup forms after an advance and looks like a bowl or rounding bottom. When cup is completed, a trading range develops on the right hand side and the handle is formed. A subsequent breakout from the handle’s trading range signals a continuation of the prior advance.” Source: stockcharts.com/school/doku.php
…It is my view that gold is in the Phase III of its Cup-and-Handle chart formation and the next breakout will bring it to $1,375 level.
It is possible for gold prices to fall below 1,200, or below 1,000 later, as many believe – but I see that as unlikely. This may happen only if:
- the Fed sets a negative interest rate going forward,
- the US stock [market] starts its long term bull run later.
Two things must happen at the same time to bring the gold price down. If the Fed keeps its current policy to raise interest rates higher, all commodity prices will go along for the ride. This will happen whether the dollar is up or down later on.
Disclosure: The original article, by Lejun James Shao (myIRAs.net) was edited ([ ]) and abridged (…) by the editorial team at  munKNEE.com (Your Key to Making Money!) to provide a fast and easy read.
“Follow the munKNEE” on Facebook, on Twitter or via our FREE bi-weekly Market Intelligence Report newsletter (see sample here , sign up in top right hand corner)

Links to More Sites With Great Financial Commentary & Analyses:
ChartRamblings; WolfStreet; MishTalk; SgtReport; FinancialArticleSummariesToday; FollowTheMunKNEE; ZeroHedge; Alt-Market; BulletsBeansAndBullion; LawrieOnGold; PermaBearDoomster; ZenTrader; EconMatters; CreditWriteDowns;