[We are at a major crossroads in the equity and bond markets.] We could see a major ‘risk-on’ rally in the S&P 500 BUT if no equity rally ensues, and U.S. Treasury note yields keep falling, then something terrible is about to strike at the heart of the global capital markets…. [As such, it is imperative that you keep a close eye on this new ‘Peak Price’ indicator. Let me explain.] Words: 450
So says John DiCecco (www.TrendCharts.ca) in edited excerpts from his original article* as posted on Seeking Alpha.
Lorimer Wilson, editor of www.munKNEE.com (Your Key to Making Money!), has edited the article below for length and clarity – see Editor’s Note at the bottom of the page. This paragraph must be included in any article re-posting to avoid copyright infringement.
DiCecco goes on to say, in part:
We have noticed something very interesting: the TLT (20-year U.S. Treasury notes) is above 122 and, over the last 12 months, any time the TLT has traded above 122 it has signaled the end of equity sell-offs (peak of fear) and the beginning of a new equity bull run.
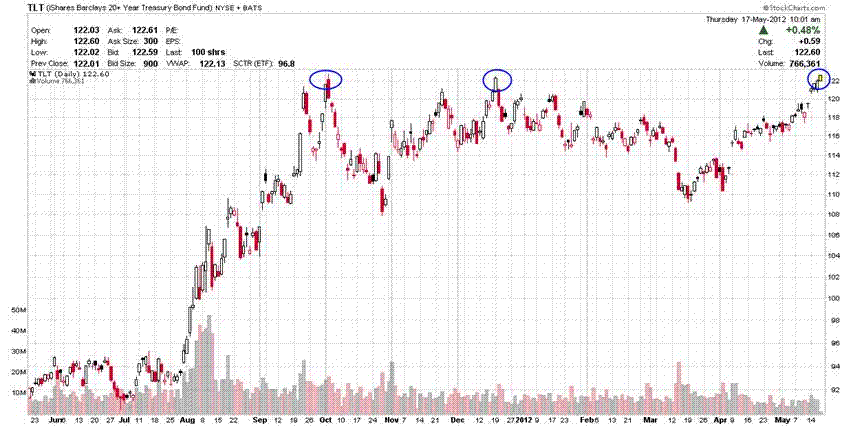
(Click to enlarge)
Let’s look at what happened to the SP500 on the two previous dates that the TLT traded above 122.00.
- October 4, 2011– the TLT hit an intra-day high of 122.16 and the SP500 hit an intra-day low of 1,074. The SP500 rallied from this low and hit a peak high of 1,284 on October 27 for a gain of 19.5% since the 122 reading on the TLT.
- December 19, 2011 – the TLT hit an intra-day high of 122.43 and the SP500 hit an intra-day low of 1,202. The SP500 then rallied from this low and hit a peak high of March 26, 2012 for a gain of 17.8% since the 122 reading on the TLT.
On May 17, 2012 the TLT hit an intra-day high of 124.28 and the SP500 hit an intra-day low of 1,304.
An 18% bounce in the SP500 from this low (similar to the bounces that occurred in October and December) would bring the SP500 to 1,538.
Automatic Delivery Available! If you enjoy this site and would like every article sent automatically to you then go HERE and sign up to receive Your Daily Intelligence Report. We provide an easy “unsubscribe” feature should you decide to opt out at any time.
Spread the word. munKNEE should be in everybody’s inbox and MONEY in everybody’s wallet!
Will this time be different or have we once again hit the floor for the yield on U.S. Treasury notes? That is, there is nowhere to go but up from here for yields, which in turn means that equity markets will also stop falling and we will experience a strong ‘risk-on’ rally?
If we do see a 15% to 19% rally in the SP500 over the next six weeks we will be able to officially name the TLT as the new Peak Fear Indicator for capital markets.
If no equity rally ensues and the TLT keeps climbing higher, and U.S. Treasury note yields keep falling, then something terrible is about to strike at the heart of the global capital markets….
*http://seekingalpha.com/article/601171-the-peak-of-fear?source=email_macro_view&ifp=0 (To access the above article please copy the URL and paste it into your browser.)
Editor’s Note: The above article may have been edited ([ ]), abridged (…), and reformatted (including the title, some sub-titles and bold/italics emphases) for the sake of clarity and brevity to ensure a fast and easy read. The article’s views and conclusions are unaltered and no personal comments have been included to maintain the integrity of the original article.
Related Articles:
1. Marc Faber: We Could Have a Crash Like in 1987 This Fall! Here’s Why

Marc Faber has stated in an interview* on Bloomberg Television that “I think the market will have difficulties to move up strongly unless we have a massive QE3 (something Faber thinks would “definitely occur” if the S&P 500 dropped another 100 to 150 points. If it bounces back to 1,400, he said, the Fed will probably wait to see how the economy develops)….. If the market makes a new high, it will be with very few stocks pushing up and the majority of stocks having already rolled over….If it moves and makes a high above 1,422, the second half of the year could witness a crash, like in 1987.” Words: 708
2. Pento: Markets Will Fall Significantly This Summer – Here’s Why
Investors are being told that the worsening sovereign debt crisis in Europe will leave the U.S. economy unscathed….[because,] since we don’t make many things to export to Europe, our GDP won’t suffer a significant decline at all…. What [has been] conveniently overlooked, [however’] is the fact that 40% of S&P 500 earnings are derived from foreign economies and the seventeen countries that make up the Eurozone have collapsed into recession. [Let me explain what effect that will have on the performance of the S&P 500 this summer.] Words: 325
3. Charles Nenner: Dow to Peak in 2012 and Then Decline to 5,000!

Charles Nenner has been accurately predicting movements in the liquid markets for more than 25 years, and his most recent cycle analysis predicts that the current stock market rally is going to last through Q2 and then begin a major descent in 2013 – with the Dow eventually reaching 5,000! Read on to learn how Nenner’s unique system works and what he forecasts for commodities, currencies, bonds, interest rates and more. Words: 400
4. NOW Is the Time to Get Out of the Stock Market! Here’s Why

With the S&P 500 at its highest level since the summer of 2008, investors previously sidelined by reoccurring fears of a double dip recession and nagging worries about a disorderly Greek default may now be tempted to hold their noses and dive into the market where, presumably, they will be swept along to the land of outsized profits by the Dow 13,000 wave. Having said this, it is worth noting that often the best time to sell is when everyone else is buying. Now may be that time. [Let me explain.] Words: 885
5. S&P 500 Should Continue Climbing Until October and Then Decline 15-30%! – Here’s Why

At the end of November 2011 the U.S. behavioral indicator for the U.S. stock market, based on insights on investor psychology, touched the crisis threshold for the fifth time (1971,1979, 1986, 2006) since 1970. If the current case follows the four prior cases, we expect a similar positive return from November 2011 to the end of October 2012 as in the four prior periods followed by a decline somewhere between 15% and 30%. [Let me explain.] Words: 317
6. Jeremy Siegel: 50% Chance of Dow Reaching 17,500 By The End Of 2013! Here’s Why

