…What is the likely market return in the coming new year? [This articles tries to answer that question by presenting]  technical and fundamental market factors that are influencing the market in the coming year. Some of these factors point to a positive market return this year while others point to negative influences. Let’s take a look.
So writes David Templeton, CFA (disciplinedinvesting.blogspot.ca) in edited excerpts from his original article* entitled Expectations For The Market In 2014.
[The following is presented by Lorimer Wilson, editor of www.FinancialArticleSummariesToday.com and www.munKNEE.com and may have been edited ([ ]), abridged (…) and/or reformatted (some sub-titles and bold/italics emphases) for the sake of clarity and brevity to ensure a fast and easy read. This paragraph must be included in any article re-posting to avoid copyright infringement.]
Templeton goes on to say in further edited excerpts:
Following are a…[number] of technical and fundamental market factors that are influencing our view of the market in the coming year. Some of these factors point to a positive market return this year while others point to negative influences.
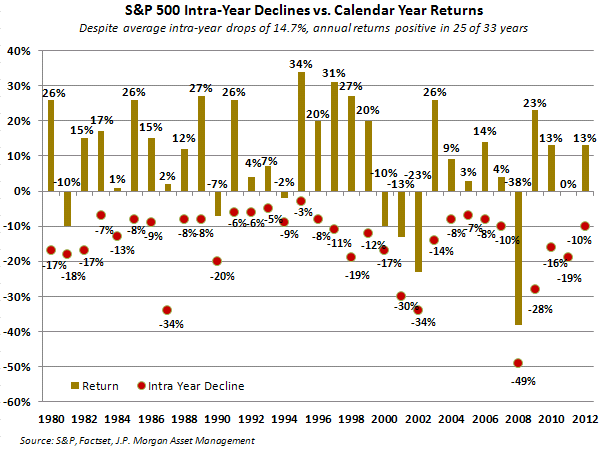
1. Past Performance
 |
| From The Blog of HORAN Capital Advisors |
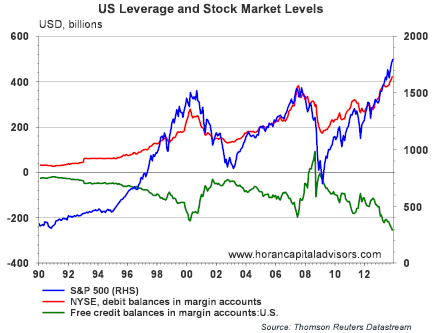
Doug Short at Advisor Perspectives wrote a detailed article on margin debt. Currently, nominal margin debt is at an all time high and the chart below shows this level of margin debt has been associated with market tops. If investors are fully leveraged their additional buying power is limited.
 |
| From The Blog of HORAN Capital Advisors |
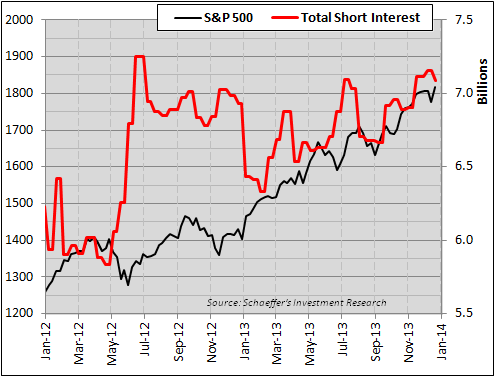
3. Short Interest
On the flip side of the high margin debt issue is the high level of short interest on S&P 500 holdings. Todd Salamone of Schaeffer’s Investment Research wrote an article, Why Stocks Could Be Set For a First-Quarter Surge, and includes a discussion on the high level of short interest as noted in the below chart. The Salamone article also details many market positives and a few market negatives that might impact the equity market in 2014.
 |
| From The Blog of HORAN Capital Advisors |
“Follow the munKNEE” via Twitter (https://twitter.com/munknee or @munknee or #munknee)
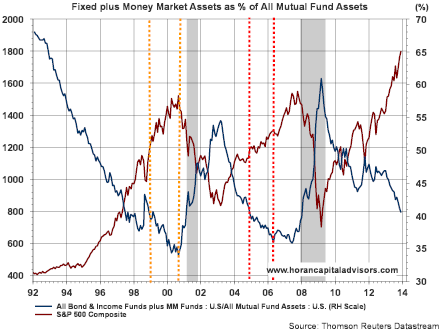
4. Mutual Fund Allocation
Short covering may be a necessary factor to push equity prices higher this year. When looking at investors’ mutual fund asset allocation it appears they are heavily weighted towards equities. The chart below details assets in money market and fixed income funds as a percentage of total mutual fund assets. The weighting in this non equity class is at near record lows. A major influence of this low weighting is the fact equity market returns were so strong last year; thus, pushing equity values to high levels.
 |
| From The Blog of HORAN Capital Advisors |
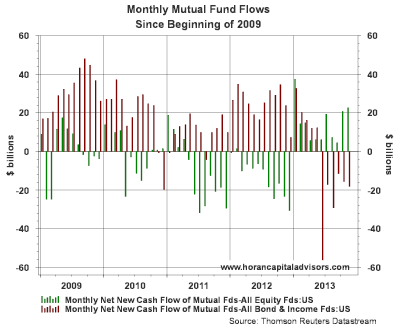
5. Mutual Fund Flows
In spite of the apparent low level of investor assets allocated to money market and fixed income investments, mutual fund flows would suggest the rotation out of fixed income investments into equities has only just begun as noted in the below chart. Not until 2013 did investors begin to rotate into equities. A recent article on the Minyanville website cites ICI data noting, “investors responded to 2013’s climate by putting $160 billion of new money into equity mutual funds (investment flow data from ICI), a dramatic shift in a market that saw five straight years of outflows totaling $536 billion.” One concern is the equity markets have had strong returns over the last five years and investors are just now rotating into equity investments. Individual investors could be arriving late to the bull market party, as they have a tendency to do.
 |
| From The Blog of HORAN Capital Advisors |
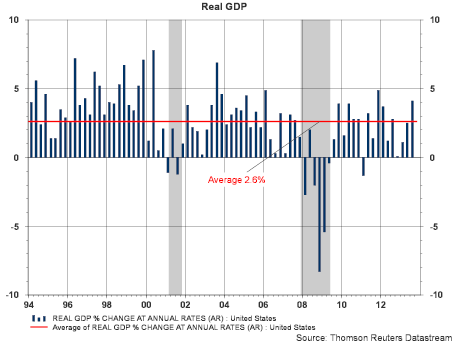
6. Real GDP Growth
From a fundamental perspective, the economy does seem to be strengthening. Real GDP in the third quarter of 2013 was revised higher to 4.1%. This is certainly a respectable rate of economic growth; however, the GDP growth rate since the end of the recent recession is below the rate of growth experienced by the economy coming out of prior recessions.
 |
| From The Blog of HORAN Capital Advisors |
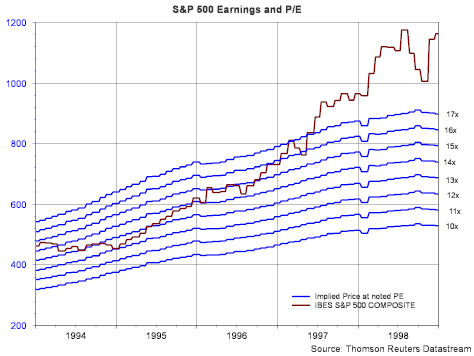
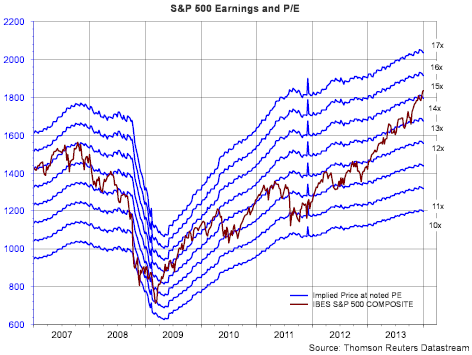
7. S&P Earnings & P/E
From an earnings perspective Thomson Reuters reports Q3 2013 earnings growth at about 6%. Earnings growth in Q4 of 2013 is expected to come in at 7.6%. Some of this earnings growth, however, has come by way of companies repurchasing their own stock. This has had the effect of inflating earnings per share growth since reported income is divided by fewer shares outstanding. We noted this strong buyback activity in a blog post a few weeks ago, Stock Buybacks Continue At A Strong Pace Through The Third Quarter. The expected earnings growth rate for all of 2014 is currently estimated at 10%. Top line revenue growth is forecast at about half this growth rate at 5.7%. Importantly, we believe companies will need to generate top line growth commensurate with expected earnings growth if 2014 returns are on par with returns in 2013.
“Follow the munKNEE” via Facebook – https://www.facebook.com/lorimer.wilson
 |
| From The Blog of HORAN Capital Advisors |
 |
| From The Blog of HORAN Capital Advisors |
Two economic variables that are different now versus the mid 1990’s is the level of GDP growth and the direction of interest rates. Multiple expansion is much easier to achieve in an environment where interest rates are falling due to how analysts value future earnings in a discounted cash flow model. In general, as interest rates decline, future earnings are valued higher in the current year period.
Sign up for our FREE Market Intelligence Report newsletter
In the mid 1990’s the 10-year Treasury rate fell from 7.8% at the beginning of 1995 to a low of 4.5% before rebounding to 6.28% in 1999. This declining rate factor was a tailwind for multiple expansion. Today, the interest rate environment is completely different. In July of 2012 the 10-year Treasury yield reached 1.4% and now stands at just over 3%. This higher rate level (and the direction) makes future earnings worth less in today’s discounted cash flow models and serves as a headwind to multiple expansion although multiple expansion can still occur when the economic growth rate is picking up steam. This occurs because investors expect company earnings to grow more quickly as the economic climate improves. Certainly the third quarter GDP report is suggestive of this. In 2014, a faster growing economy will be an important factor in order to generate outsized returns in the equity market.
“Follow the munKNEE” – Set up an RSS feed: It’s really easy – here’s how
Conclusion
What is evident from the above factors is the fact the data is mixed in regards to technicals as well as fundamentals. This mixed type of data has been prevalent since the end of the financial crisis and is likely a factor that has prevented investors from appearing to go ‘all in’ on stocks. While there are a number of other factors we are reviewing at HORAN Capital Advisors in assessing the markets in 2014….we hope this provides you with a few of the potential influences that may impact the market in 2014….
[Editor’s Note: The author’s views and conclusions in the above article are unaltered and no personal comments have been included to maintain the integrity of the original post. Furthermore, the views, conclusions and any recommendations offered in this article are not to be construed as an endorsement of such by the editor.]
Don’t forget to “tweet“ or “like“ those articles you wish to share with others
Related Articles: (Please note: The articles posted on munKNEE.com deliberately present a diverse perspective on subjects discussed. Below are links, with introductory paragraphs, to a variety of related articles designed to help you become truly informed regarding both sides of the issues so that you can assess the merits of all points of view and come to your own conclusion.)
1. This Chart of the Dow Suggests “Bring on 2014 – We Ain’t Seen Nothin’ Yet!”

The Dow is up almost 28% but the chart below showing how it’s 12% annualized gain over the past 5-years compares with past bull markets suggest we are probably not at a top – that “We ain’t seen nothin’ yet!” Take a look. Read More »
2. Stock Market Bubble Going to Burst & Unleash Destructive Forces on Global Economy

The Fed has manufactured a parabolic move in the stock market…which is much more aggressive (and thus even more unsustainable) than witnessed at either the 2000 or 2007 stock market tops. Parabolas always collapse – there are never any exceptions – so when the pin finds this bubble it’s going to take down not only our stock market, but unleash a destructive force on the global economy. Read More »
3. Warren Buffett’s Favorite Valuation Metric Suggests Stock Market Is OVERvalued by 15%

Here’s some perspective on the potential value of the U.S. equity market using Warren Buffett’s favorite valuation metric – total stock market capitalization relative to GDP. Read More »
4. S&P 500 & Dow 30 Index Performances: Illusion vs.Reality
The Dow Jones Industrial Average is a fabricated number that has little relation to the actual average performance of the stock market as a whole. For sure, it is not industrial in nature, and by no means is it an average. It’s like creating an all-star team of the very best-performing companies and broadcasting to the world that this is the average of all companies out there. Read More »
5. These Indicators Suggest Stock Market Returns Are “Too Good To Be True”

Current macro conditions indicate that we are in a sweet spot for equity returns…that global growth is continuing and there is little or no tail risk in the immediate future. It’s time to get long equities…but I have this nagging feeling that these market conditions are too good to be true. If you look, there are a number of technical and fundamental clouds on the horizon. Read More »
6. Don’t Be Scared “Stockless”! There’s No Fear Anymore – Anywhere!

There’s no fear anymore – anywhere – and I’m talking about the type of fear that overwhelms investors – and, in turn, the market. The surest indication of this can be found in the following chart. Read More »
7. Stocks to Continue to Soar & Gold to Continue to Fall in 2014 – Here’s Why
Each December we publish a list of investment themes that we feel are critical to the coming year. Below are our expectations for the U.S, Japanese and European stock markets, municipal bonds and gold. Read More »
8. Relax! Take Stock Market Bubble Warnings With a Grain of Salt – Here’s Why

Bubble predictions are headline-grabbing claims that are sure to attract reader/viewership and more than a few worried individuals who will be pushed to act but, like all forecasts, these bubble warnings should be taken with a grain of salt. Read More »
9. Grantham: No Market Bubble for a While – But It’s Coming!
I would think that we are probably in the slow build-up to something interesting – a badly overpriced market and bubble conditions. My personal guess is that the U.S. market, especially the non-blue chips, will work its way higher, perhaps by 20% to 30% in the next year or, more likely, two years, with the rest of the world including emerging market equities covering even more ground in at least a partial catch-up. Read More »
10. Taking the Temperature of the U.S. Stock Markets: What’s Hot, What’s Not

11. Stock Market Bubble & Coming Recession? These Charts Say Otherwise

The real value of the stock market is positively correlated, over time, with the amount of freight hauled by the nation’s trucks (in other words, the physical size of the economy has a lot to do with the real, inflation-adjusted value of the economy) and the latest numbers (see chart) strongly suggest that we are not in a stock market bubble. Read More »
12. These 2 Stock Market Metrics Make Me Feel Uneasy – What About You?

It’s been an amazing run in the stock market but…I start to feel a bit uneasy about things when I see all news reported as good news, because it either means the economy is getting better or more QE is coming. The fact, though, is that the market is just driving higher on what looks like sheer optimism of continued QE and little else. You can see this optimism in two indicators you’ll recognize. Read More »
13. 4 Clues That a Stock Market Collapse Is Coming
You might be well advised to keep your powder dry and your portfolio small – or even be tempted to sell everything and wait for the storm to blow over [given the 4 clues put forth in this article]. Read More »
14. Yes, You Can Time the Market – Use These Trend Indicators
Remember, the trend is your friend and now you have an arsenal of such indicators to make an extensive and in-depth assessment of whether you should be buying or selling. If ever there was a “cut and save” investment advisory this article is it. Words: 1579 Read More »


