Third-quarter reporting season is set to begin [and,] as a result, the troubles in Europe are about to become background music as investors once again focus on individual company fundamentals and when it does, here are the three most important statistics we need to track. Words: 545
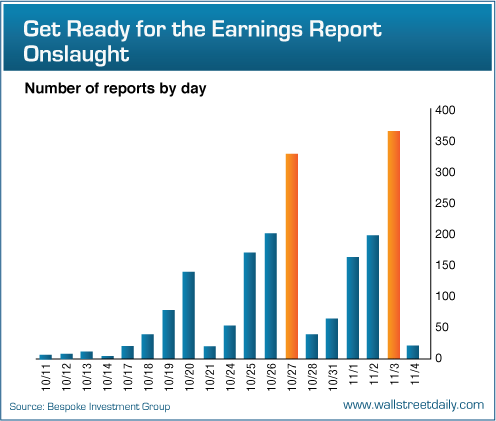
Based on the chart below, we can expect the attention to shift in a matter of [days].
Here are the three most important statistics we need to track:
1. Earnings “Beat Rate”
It is a proven fact that stock prices ultimately follow earnings [because,] as long as companies are producing more and more profits, stock prices are likely to charge higher. As Benjamin Graham [put it], “In the short run, the market is a voting machine, but in the long run it is a weighing machine.”
Who in the world is currently reading this article along with you? Click here to find out.
Instead of dissecting every last earnings report to discern the trend in corporate profits, though, all we have to do is monitor the earnings “beat rate” – the percentage of companies beating analysts’ expectations for profits. A reading above 65% is particularly bullish and anything below 50% is bearish.
2. Revenue “Beat Rate”
With serious concerns swirling [about] that the U.S. economy might be entering another recession, earnings growth won’t be enough. Investors want more because the earnings game can be rigged – by cutting costs, boosting productivity, etc. – to conceal a drop off in demand. Revenue figures can’t be faked, however, and they represent the surest sign that demand for goods and services are increasing.
Here, too, we don’t need to worry about reviewing every last company report. We just need to track the revenue “beat rate” – the percentage of companies beating analyst expectations for sales. Again, a reading above 65% is considered particularly bullish and anything below 50% is bearish.
3. Guidance Spread
Since the stock market is a forward-looking beast, past results don’t matter as much as expectations for the future and that’s where company guidance comes in. Companies aren’t required to issue guidance – about 50% to 55% not to do so – but we can still track the guidance of…those that do] to determine whether or not they expect better times, worse times, or the status quo.
We can track the guidance spread, [i.e.,] the difference between the percentage of companies raising guidance and the percentage of companies lowering guidance. A positive spread indicates that more companies are optimistic about the future. And a negative spread indicates that more companies are pessimistic.
The guidance spread has ranged from 1% (2Q 2011) to 5.2% (4Q 2009) since the current bull market began so anything above 1% should be considered bullish.
Bottom line:
The more companies that can beat earnings expectations, beat revenue expectations and raise guidance, the more likely the stock market is to rally into the end of the year.
*http://seekingalpha.com/article/298850-3-statistics-that-will-move-the-markets-in-the-coming-weeks?ifp=0&source=email_macro_view
The article highlights three factors its author says are the three most important company fundamentals the equity markets react to (my words) being (1) the ‘earnings beat rate’, (2) the ‘revenue beat rate’, and (3) the ‘guidance spread’ – and that because the third-quarter earnings season is set to begin, the troubles in Europe are about to become background music.
My observations on this:
•Corporate acquirers and private company owners don’t think remotely like this. In my experience quarterly earnings play very little part in any valuation/acquisition analysis those groups do. The exception to this is that where a corporate acquirer is itself public and looks to make a business acquisition, it factors into its analysis whether the equity markets will see the acquisition as accretive or not (i.e. is it likely the equity markets will immediately add more value to the acquiring company’s market capitalization than it is paying for the acquisition);
•From 10,000 feet, the author’s view that ‘the troubles in Europe are about to become background noise’ – if proven to be true, and I suspect that unfortunately there may be more than a little truth in it – clearly demonstrates for me the ‘immediacy of the equity markets in a ‘pricing context’ as contrasted with an ‘underlying value context’. Value at a point in time is the present value of all future discretionary after-tax cash flow expectations to infinity. Price is what at a given point in time arm’s length parties will buy and sell something for. One person’s perception is not that person’s reality if everyone else thinks the opposite. In a public equity markets context the reality today is, or so I think, that the equity markets are largely trading markets and hence dangerous ‘short term places’ for value investors who actually do invest based on underlying valuation fundamentals but don’t have the deep pockets or the stomach to hold for the long term;
•I see the author’s ‘earnings beat rate’ observation worrisome on three counts, being (1) the fact that I do believe the equity markets act in knee-jerk reactions to this factor, (2) accounting earnings are based in part on the application of subjective accounting rules, and hence are subject to vagaries of the opinions of those that prepare them (company management), review them (company Boards), and approve them (independent accounting firms). Hence quarterly earnings may prove with hindsight to be over or under-stated, and (3) in the case of public companies dependent on the public capital markets, company Boards and managements are under tremendous pressure to show quarter/quarter earnings growth. This is because the price earnings ratios that the equity markets so love as a ‘primary value indicator’ have a subjectively determined continuous growth factor built into them. This is a pressure on public company boards and managements that inherently promotes optimism is reporting. What public company President with stock options wants to report level profitability – or heaven forbid – reduced quarter/quarter profits. No private company owner I have known over a forty year period measures their progress on their company’s quarterly results to any significant degree – unless their company is in financial difficulty and has to worry about failing to meet its banking covenants. Quarterly earnings are to me are not close to being as meaningful as a ‘corporate (and hence share) value test’ as are discretionary after-tax cash flows. Hence I believe that while quarterly reported earnings are relevant to traders, they ought to be very much less relevant to investors than the public equity markets make them. There is, of course, also the question of how well the analysts who generated the ‘earnings estimates’ against which quarterly profits are measured in a ‘beat test’ did their analysis. Earnings estimates may very well be given more credibility than they deserve in circumstances where equity market participants take them as very meaningful;
•While the equity markets may very well look to the ‘revenue beat rate’, that is for me a very ‘surface’ test of either value or price. Detailed questions with respect to whether or not there have been non-recurring revenues in the quarter, whether revenue growth is likely to continue, what gross margins were generated on revenues in the quarter and whether those gross margins are going to hold up, decrease, or improve going forward, and so on, all have to be addressed to make a ‘revenue beat rate’ analysis meaningful. The same subjective accounting issues arise with revenues as arise with reported earnings. Were quarter-end cut-offs consistent with prior quarter cut-offs is only one of these. Based on analyst’s reports I have reviewed to date, I question whether this level of detail is always dealt with when analysts make their quarterly estimates. That said, I also think this isn’t relevant in the context of the equity markets behavior around analyst estimates, save and except to suggest that the entire process probably in fairness can be described as a ‘best efforts process’; and,
•the so-called ‘guidance spread’ is described in the article as the difference between the % of companies raising versus lowering guidance where slightly less than 50% of all companies across all industry sectors (as I read the article) issue guidance. The author says that anything above a +1% guidance spread “should be considered bullish”. I have no idea how this is relevant to anything in terms of the price behavior of specific equities, but presume as an ‘equities markets direction test’ the author adheres to the theory of ‘a rising market raises all boats, and an falling market drops all boats’.
In the end, to the extent the type of thinking exhibited in this article pervades the public equity markets, and I believe it probably does, I believe this is a good reason to step back from them, decide whether you want to participate in them, and if you do want to participate in them think very hard about what I see as the importance of taking ever more responsibility for, and involvement in, the management of your own wealth. I believe this to be ever more important in the current, and I believe prospective, macro-economic and country-specific economic world we live in.
Ian Campbell
http://www.stockresearchportal.com