A Fed rate hike could be a catalyst for a decent rebound in hard assets and in gold stocks especially. However, the key word is rebound. History argues for a rebound in the weeks to come but a rebound followed by new highs in the US$ index and new lows in precious metals. This fits with our expectation that the US$ index could surge higher in 2016 and lead to capitulation and the end of the bear market in Gold and Silver.
The chart below plots the US$ index, the Fed Funds rate and Gold. We marked the points at which the Fed Funds rate began to increase. The red marks show the two points which are most comparable to today with respect to the US$ index. At those points (1983-1984 and 1999) an increase in the Fed Funds rate was preceded by a strong uptrend in the US$ index.
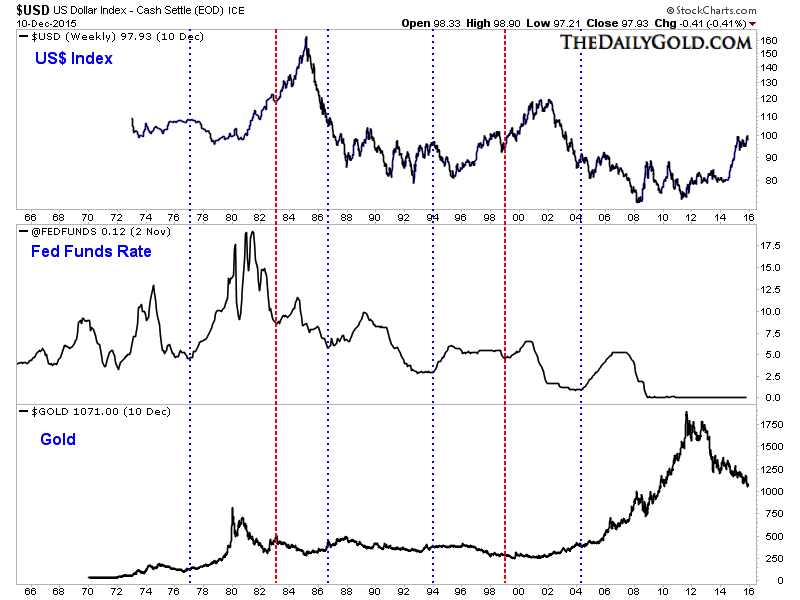
The Fed Funds rate increases in 1983-1984 were preceded by US$ strength but also massive rebounds in Gold and gold stocks. From mid 1982 into early 1983 Gold rebounded by 73% and the Barron’s Gold Mining Index rebounded by 210%.
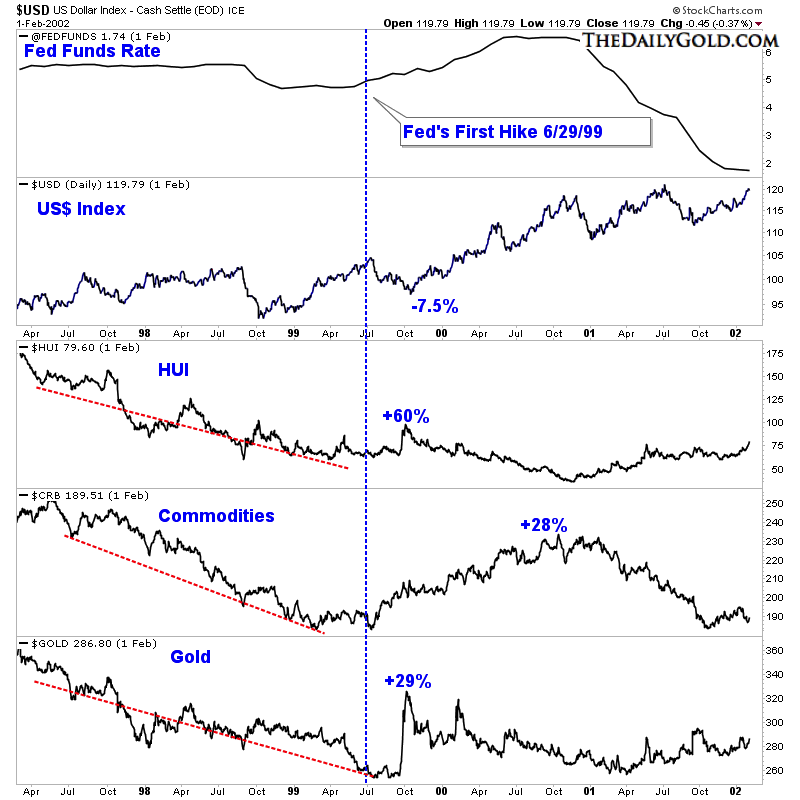
The Fed Funds rate increase in 1999 is most applicable to today because it was preceded by US$ strength and steep declines in Gold, gold stocks and Commodities. (It was also preceded by strength in US equities and major weakness in emerging markets).
The chart below shows how various markets performed before and after the rate hike in summer 1999. The US$ index declined by 7.5% while Gold and gold miners surged higher. The counter-trend move lasted the longest in Commodities. Another similarity to note, albeit small, is the gold miners (HUI) did not make a new low before the hike as Gold did.
The gold mining indices (GDX, GDXJ, HUI) have essentially held support and built a base since July. GDXJ (shown below) figures to close the week in the mid $19s.
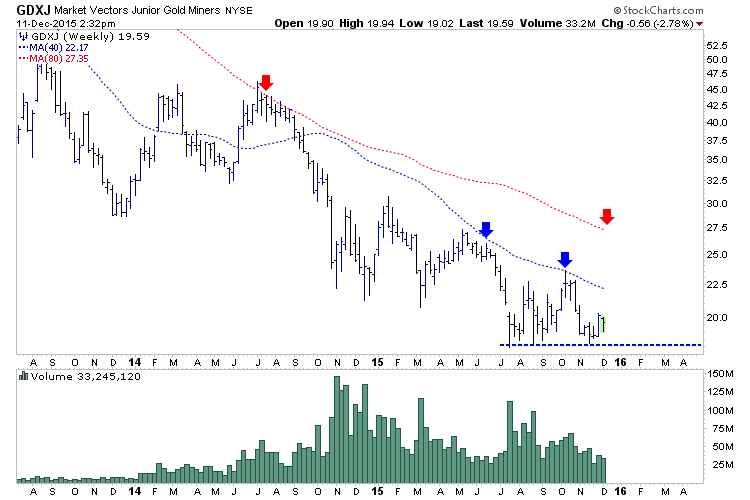
If history repeats itself (with respect to Fed actions) then a rebound should begin in the GDXJ after the hike and last for a few months. The initial target would be the 200-day moving average ($22) followed by the October high (mid $23) and the 400-day moving average ($27).
Want more such articles? Just “follow the munKNEE” on Twitter; visit our Facebook page; or subscribe to our free newsletter – see sample here.
The original article was written by Jordan Roy-Byrne, CMT (TheDailyGold.com) and is presented here by the editorial team of munKNEE.com (Your Key to Making Money!) and the FREE Market Intelligence Report newsletter (see sample here – register here) in a slightly edited ([ ]) and abridged (…) format to provide a fast and easy read.]
Related Article from the munKNEE Vault:
Gold & Silver Will Plummet In 1st Qtr. of 2016 – Then Go Parabolic!
My new analyses of gold & silver indicates they will both continue to show weakness throughout the balance of 2015, plummet to $725ozt. & $12ozt. respectively, during the 1st. Qtr. of 2016 and then go absolutely parabolic in price by the end of 2016/early 2017. Below are the specific details of my forecasts (with charts) to help you reap substantial financial rewards should you wish to avail yourself of my insightful analyses.