When we witness a break of the $1,400 resistance, we expect to see a continuation of the gold bull  market with a long-term target of $2,700. Here’s why.
The comments above and below are excerpts from an article by Christopher Aaron (iGoldAdvisor.com) which has been edited ([ ]) and abridged (…) to provide a faster and easier read.
Gold Testing Critical Down Trend
From a technical standpoint, the $300 surge higher from the December 2015 low at $1,045 per ounce has now brought gold up to a direct challenge against its long-term down trend, which extends back to the all-time high set in 2011 at $1,923 per ounce (shown in magenta on the chart below).
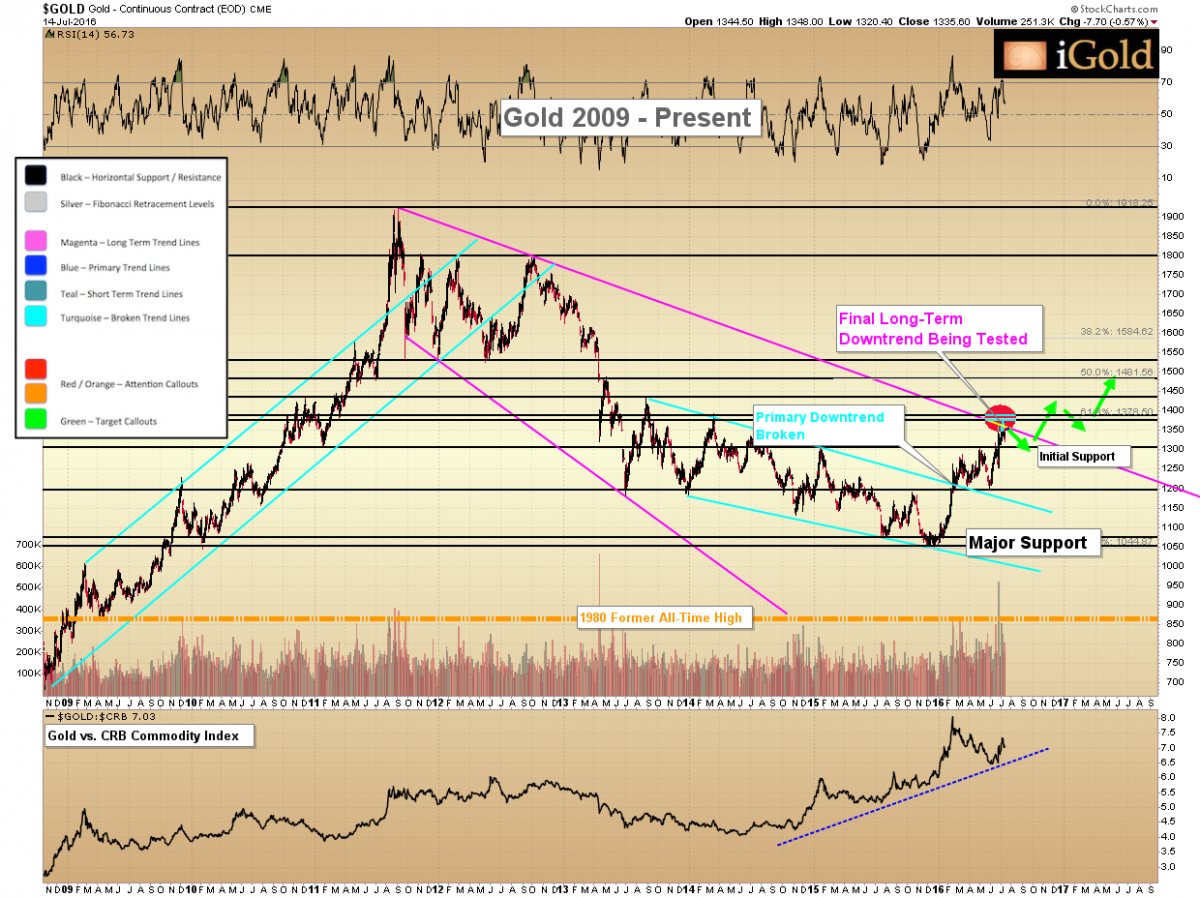
The trend line comes in right below $1,400 per ounce, just a few dollars higher than the $1,378 figure hit last week.
The significance of the down trend test gold is now facing should not be understated. Many technical-based buyers are still sitting on the sidelines watching, not willing to commit to gold until this basic but critical trend is finally broken. Furthermore, those bearish on gold who want to profit from a fall in the price are also taking their cues from this pattern, choosing to short gold below the $1,400 level. Meanwhile, we see buyers stepping in each time gold falls into the low $1,300’s. There is a true battle playing out between these two camps.
From a technical standpoint, we do have to admit that this long-term down trend has not yet been broken. Moreover, it remains valid until a clear surge takes gold prices above $1,400 in a convincing fashion.
Long-Term Ramifications Of The Pattern
Let us now back the chart out to a 35-year timeframe and change it to a logarithmic scale to put this price action into better perspective.
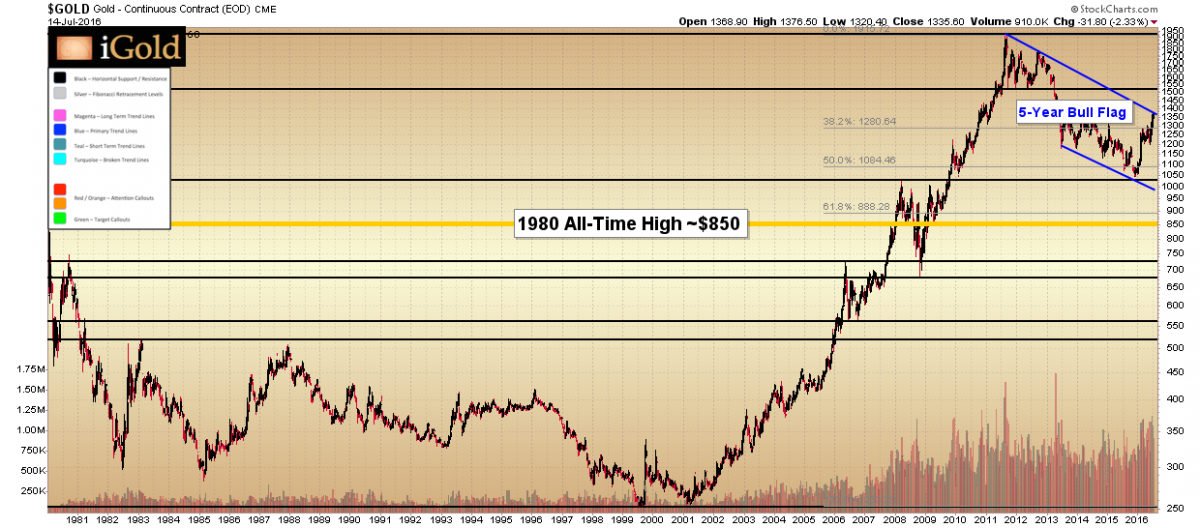
What becomes apparent when we view the 2011-current decline in this view is that the gold market is forming the middle section of a generational bull flag pattern.
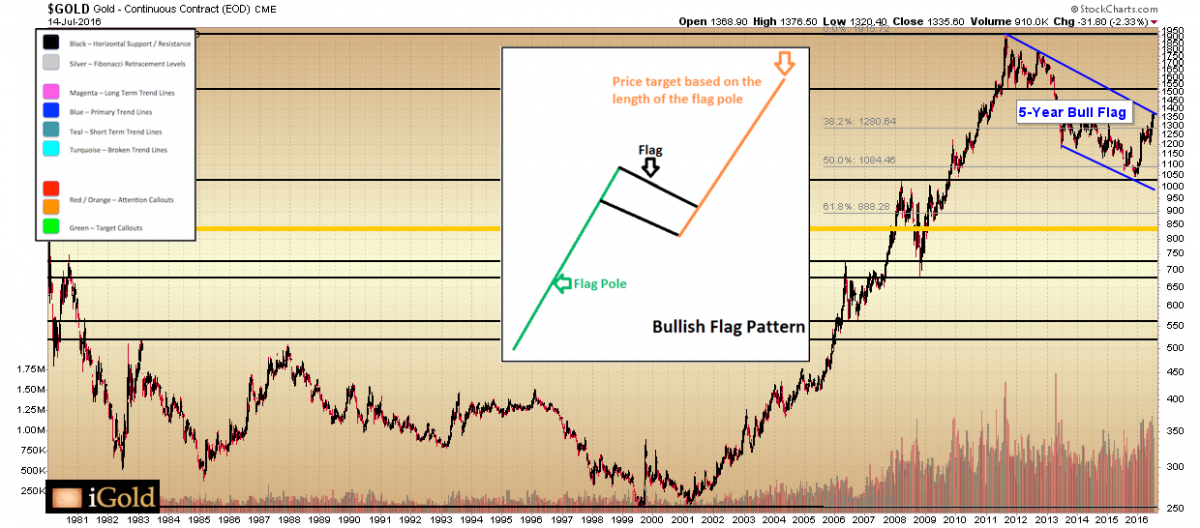
For reference, below is a reprint of the bull flag pattern as it might appear in a standard textbook on technical analysis.
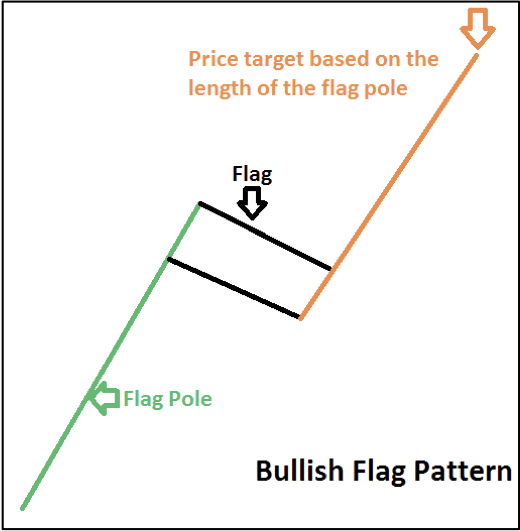
The bull flag pattern forms in three distinct phases.
- First, a long bull market forms the flag pole section, shown in green above. For gold, this correlates with the 10-year rise from $250 to over $1,900 during the 2001-2011 timeframe.
- Next forms the flag section of the pattern. Such is a protracted decline that slopes against the primary upward move. In the case of gold, the decline is the 5-year bear market from 2011-2016, which is still being held in check by the down trend that is evident on our two gold charts above.
- The break of the upper declining trend line – currently being tested near the key $1,400 level – represents the technical trigger that sets the pattern up for the next advance. It is the same trigger that the aforementioned technical buyers are waiting to see before they begin committing capital to the precious metals sector. Typically, the subsequent advance is at least equal to the initial surge.
The initial surge in gold’s case measured $1,650 (the amplitude from 2001-2011). Furthermore, we derive a target for the bull flag pattern by adding this figure to the most recent low of approximately $1,050. In sum, when we witness a break of the $1,400 resistance, we expect to see a continuation of the gold bull market with a long-term target of $2,700.
Timing For The $2,700 Gold Target
Once again, the bull flag formation has not yet been confirmed. Such will happen when we witness a surge through the $1,400 level, as shown in the first chart. It is quite possible that gold may need to correct here in the short run, perhaps back to $1,285, before a period of consolidation through the fall. However, when the key down trend is broken, we will confirm this long-term target of $2,700.
Such targets may typically be expected to take an equal amount of time to manifest as the initial surge seen as the ‘pole’ of the formation. Such would be in the realm of 10 years from the breakout point, which, if it occurs this year, puts that target at 2026…
Current prices will be seen as one of the last great buying opportunities when we look back a decade from now. The bull flag pattern is nearing completion. Moreover, a strong advance above $1,400 will be the trigger that manifests growing recognition for gold as a worthy component of investors’ portfolios. The long-term targets ahead of us are significantly higher than current prices…
Disclosure: The above article has been edited ([ ]) and abridged (…) by the editorial team at  munKNEE.com (Your Key to Making Money!) to provide a fast and easy read.
“Follow the munKNEE” on Facebook, on Twitter or via our FREE bi-weekly Market Intelligence Report newsletter (see sample here , sign up in top right hand corner)

Links to More Sites With Great Financial Commentary & Analyses:
ChartRamblings; WolfStreet; MishTalk; SgtReport; FinancialArticleSummariesToday; FollowTheMunKNEE; ZeroHedge; Alt-Market; BulletsBeansAndBullion; LawrieOnGold; PermaBearDoomster; ZenTrader; EconMatters; CreditWriteDowns;