Valuation-based forecasting models leave little doubt that stocks are priced to deliver very poor long-term returns and the cyclical bull market from 2009 is an extreme move that will almost certainly be followed by a violent correction. [Let me explain.] Words: 701
So says Erik McCurdy (www.prometheusmi.com) in excerpts from an article* which Lorimer Wilson, editor of www.munKNEE.com (It’s all about Money!), has further edited ([ ]), abridged (…) and reformatted below for the sake of clarity and brevity to ensure a fast and easy read. Please note that this paragraph must be included in any article re-posting to avoid copyright infringement. McCurdy goes on to say:
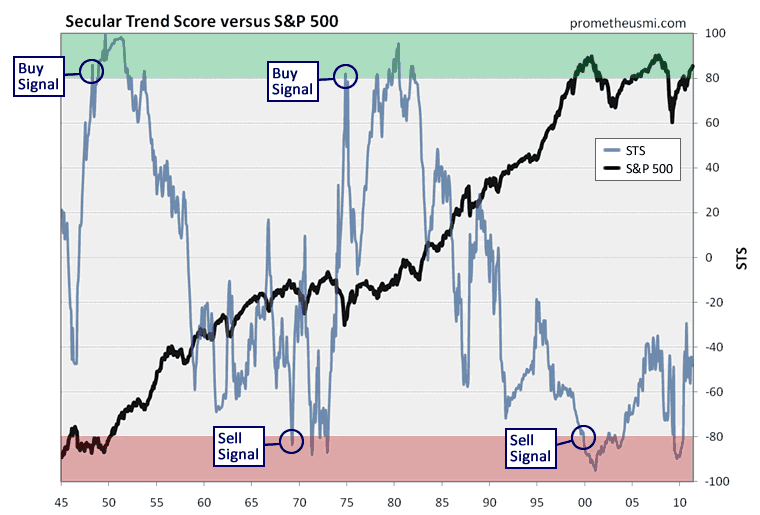
Secular Trend Score Says…
Our Secular Trend Score (STS) [vs. the S&P 500 as shown in the chart below] indicates that we yet to even approach positive territory since the last secular sell signal was issued in late 1999, suggesting that the start of the next secular bull market is still several years away.
Who in the world is currently reading this article along with you? Click here to find out.
Butler/Philbrick Model Says…
Highly reliable valuation-based models that forecast future market returns using data such as the Shiller cyclically-adjusted price-to-earnings ratio, the Q-Ratio, long-term price deviations and total return trends [such as the] study conducted by Adam Butler and Mike Philbrick of Butler|Philbrick & Associates, confirm the long-term outlook provided by our STS. The following graph from DShort.com displays 15-year actual stock market returns and projected returns since 1900 using the Butler/Philbrick model.
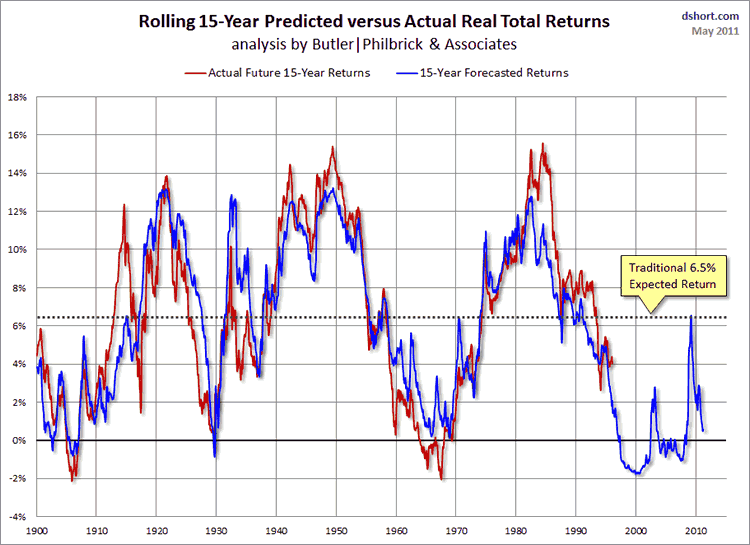
With a couple of notable exceptions, actual returns have tracked projected returns almost exactly during the past 110 years. Currently, this model projects that stocks will return -0.5% during the next 10 years and 0.6% during the next 15 years. In other words, stocks are likely to produce no gains for the next 15 years. Of course, the stock market is likely to go nowhere in an interesting way, experiencing violent advances and declines as the secular bear market moves into the final phase of its development. However, the fact remains that stocks are priced to deliver historically poor returns as investment vehicles for the foreseeable future.
Sign up for your FREE weekly “Top 100 Stock Index, Asset Ratio & Economic Indicators in Review”
Current Cyclical Bull Market Chart Says…
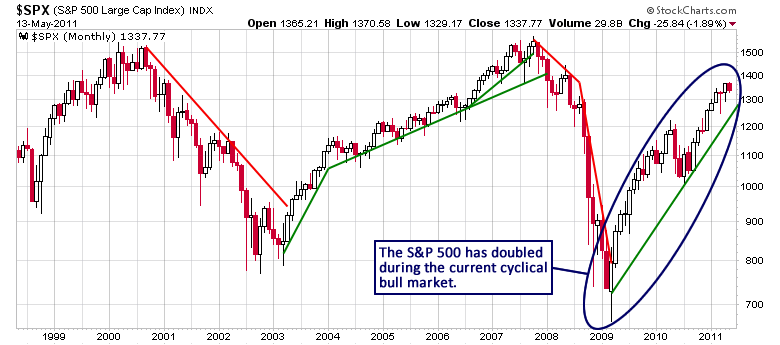
While valuation-based forecasting models project a poor long-term outlook, chart analysis and internal data also suggest that the stock market has entered a period of heightened risk from an intermediate-term perspective. The current cyclical bull market from March 2009 [see chart below] has been an extreme move, resulting in a doubling of the S&P 500 index during the course of 24 months.
Historical Stock Market Cyclical Inflection Points Say…
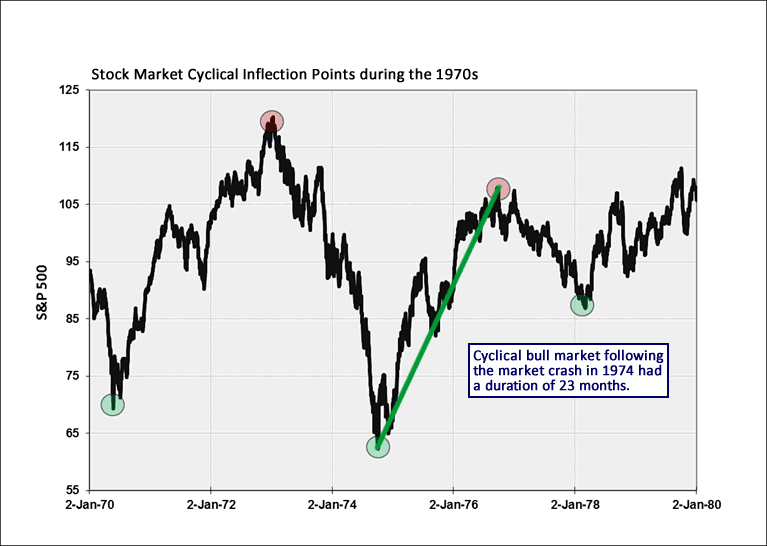
The rally is now 26 months old and cyclical bulls that occur during secular bears have an average duration of 33 months. The last cyclical uptrend that followed a market crash occurred in 1974 and had a duration of 23 months [see chart below], so it would not be unusual for the current advance to terminate during the next few months.
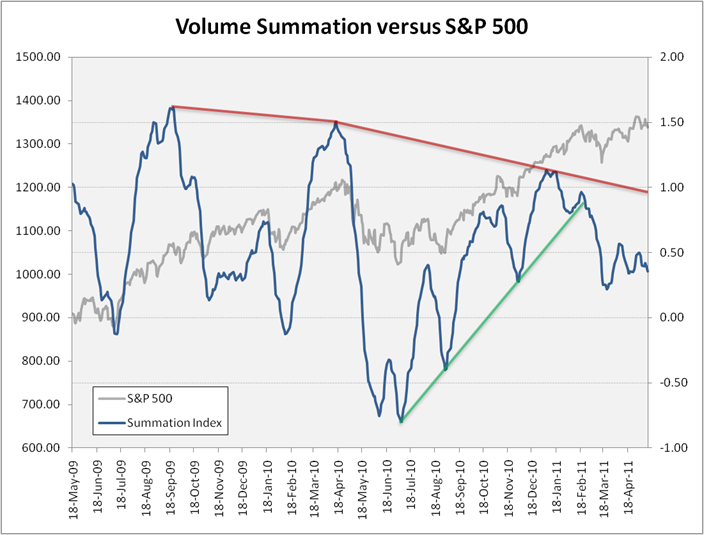
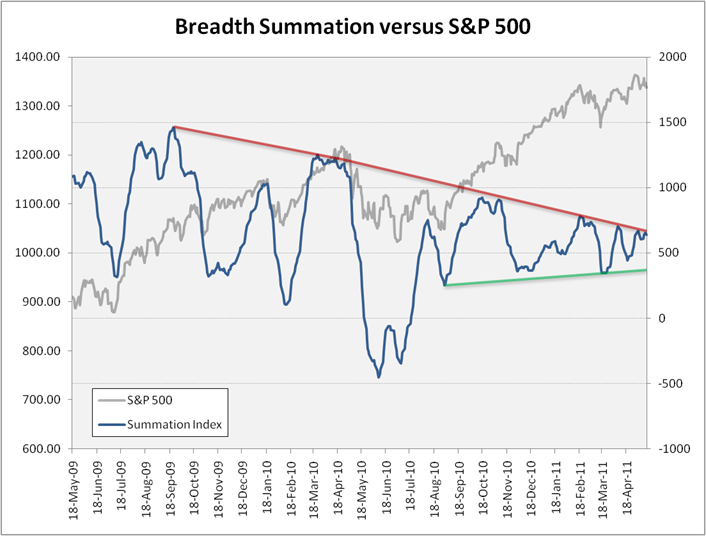
Volume and Breadth Summations vs. S&P 500 Say…
Additionally, market internals continue to negatively diverge from price behavior, indicating that the rally is gradually losing buying support. For example, volume summation continues to hold near recent lows following the sharp decline in February and breadth summation has been moving sideways for the past year.
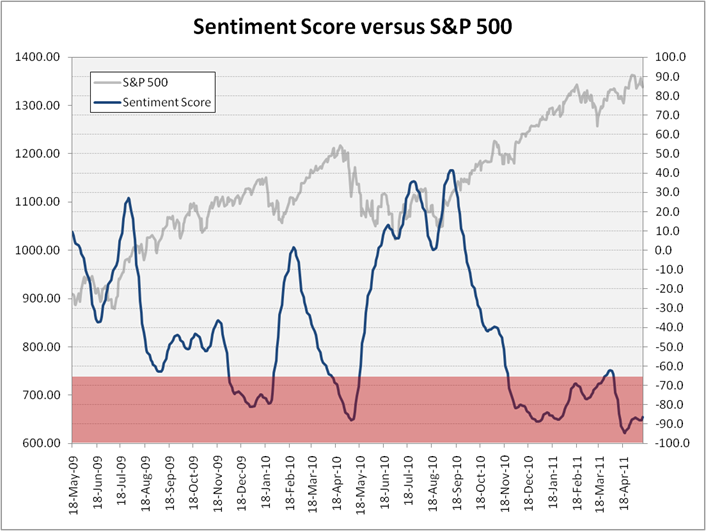
Sentiment Score vs. S&P 500 Says…
Finally, our sentiment score recently declined to the lowest level since late 2007, reflecting an excessive amount of bullish sentiment that leaves the stock market vulnerable to an abrupt, violent decline.
Conclusion
At a current duration of 26 months, the cyclical uptrend has reached the age range within which rallies typically end when they occur during secular bear markets and market internals and sentiment are not supportive of additional gains, so stocks currently offer a poor risk/reward ratio as both investing and trading vehicles.
 If you enjoyed this post click here to subscribe to a complete feed and stay up to date with today’s challenging market!
*http://seekingalpha.com/article/270024-market-s-risk-reward-ratio-remains-poor
Related Articles:
- Stock Market is Due for a 15-20% Correction – Here’s Why https://munknee.com/2011/06/stock-market-is-due-for-a-15-20-correction-heres-why/
- Today’s Market Breadth is Bad Breath for Tomorrow’s Market – Here’s Why https://munknee.com/2011/05/todays-market-breadth-is-bad-breath-for-tomorrows-market-heres-why/
- Why – and How Best to Play – a Major Stock Market Correction is Imminent https://munknee.com/2011/05/why-and-how-best-to-play-a-major-stock-market-correction-is-imminent/
Editor’s Note:
- The above article consists of reformatted edited excerpts from the original for the sake of brevity, clarity and to ensure a fast and easy read. The author’s views and conclusions are unaltered.
- Permission to reprint in whole or in part is gladly granted, provided full credit is given as per paragraph 2 above.
- Sign up to receive every article posted via Twitter, Facebook, RSS Feed or our FREE Weekly Newsletter.
Stock Market