This article examines 5 fairly exciting things going on which, at the very least, could  keep the U.S. economy from slumping, and enable equities to continue to climb.
The above introductory comments are edited excerpts from an article by Scott Grannis (scottgrannis.blogspot.ca) entitled Stocks climb walls of worry.
Grannis goes on to say in further edited excerpts:
There are so many things to worry about!
- Profits might be mean reverting, which could mean a big fall lies ahead;
- geopolitical tensions are historically high;
- the U.S. economy is still mired in the weakest recovery in history;
- President Obama’s approval ratings are at an all-time low;
- Obamacare has thrown the healthcare and jobs market for a loop;
- Dodd-Frank is crippling the financial industry;
- Europe is flirting with its third recession in the past 7 years;
- Japan is still struggling despite massive monetary stimulus;
- emerging markets are being punished by a stronger dollar and declining commodity prices;
- the Chinese economic juggernaut is running out of steam;
- QE3 is almost finished, and the Fed’s next move is almost certainly going to entail higher interest rates
- the bull market in equities has been underway for 5½ years, during which time the total return of the S&P 500 index has been an astounding 222%, for an annualized return of just over 23%…[compared with the total return on equities over the long haul of around 8% per year.
- corporate profits are at record highs, in nominal and real terms, and in relation to GDP,
- the classic precursors of recession (e.g., tight money, high real interest rates, and a flat or inverted yield curve) are so far completely absent,
- the PE ratio of the S&P 500 is 17.6, which is only slightly above its long-term average of 16.
The rally could continue; it’s arguably nowhere near bubble territory.
The Correlation Between the S&P 500 Index & the Ratio of the Vix Index to the 10-yr Treasury Yield
The chart below compares the S&P 500 index to the ratio of the Vix index to the 10-yr Treasury yield:
- The Vix index, by itself, is an excellent proxy for the market’s level of fear and uncertainty (a rising Vix index means that options on equities are becoming more expensive, which in turn means the market is willing to pay more for options since owning options reduces ones’ exposure to risk).
- The 10-yr Treasury yield has been an excellent barometer of the market’s confidence in the strength of the U.S. economy (Treasury yields fall as investors are willing to accept a lower yield in exchange for their safety, thus making them a refuge in times of weak or negative economic growth).
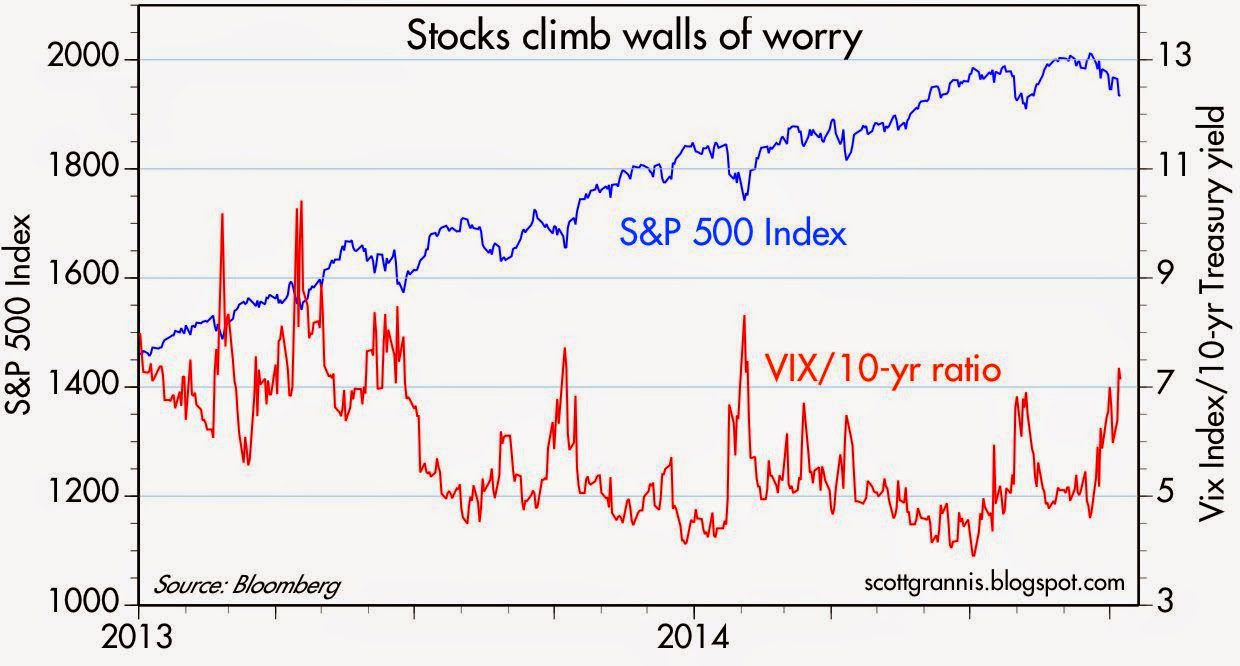
The ratio:
- rises as fear rises and confidence in the economy declines, and it
- falls as fear declines and confidence in the economy rises.
While it is not surprising, at all, that for most of this year, the correlation between the S&P 500 index and the ratio of the Vix index to the 10-yr Treasury yield has been almost perfectly negative: -0.85, what is of interest, however, is the number of times a significant rise in the Vix/10-yr ratio has coincided with a meaningful decline in equity prices (at least 7 times in less that 2 years, by my count).
Yet each flare-up of worry has subsided, as the fears that worried investors failed to materialize and the U.S. economy kept on growing at a 2-2 ½% pace. In the absence of an actual recession, it’s tough to keep the equity market down, especially since the alternative to being exposed to equity risk means giving up tons of yield (and in the case of going to cash, it means giving up yield entirely). The earnings yield on the S&P 500 is currently 5.7% (the inverse of the PE ratio) while the yield on nominally risk-free 5-yr Treasuries is a only 1.6% and the real yield on risk-free 5-yr TIPS is zero.
Despite the long list of worries, there is still no sign that the U.S. economy is about to roll over.
- Trillion dollar shots of stimulus and Quantitative Easing failed to stimulate growth,
- a massive contraction of the federal budget deficit failed to kill growth.
- The U.S. economy so far has managed to almost completely ignore:
- the weakness of the Eurozone economy and
- the big slowdown in Chinese economic growth.
The U.S. economy is massive in size and over the years has proven to withstand all manner of difficulties (e.g., recall that 9/11 came very near the end of the 2001 recession).
In fact, there are some fairly exciting things going on which, at the very least, could keep the U.S. economy from slumping, as follows:
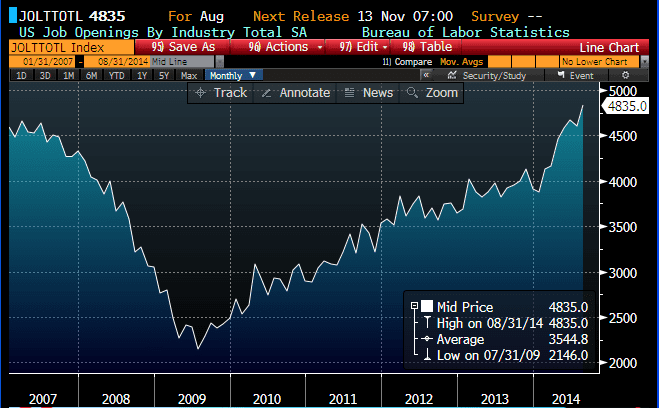
1. Job Openings
As the chart below shows the BLS’ measure of job openings has jumped by almost 24% year to date, and now surpasses the peak in job openings prior to the last recession. This suggests the outlook for the economy is brighter since businesses are more confident in the future.
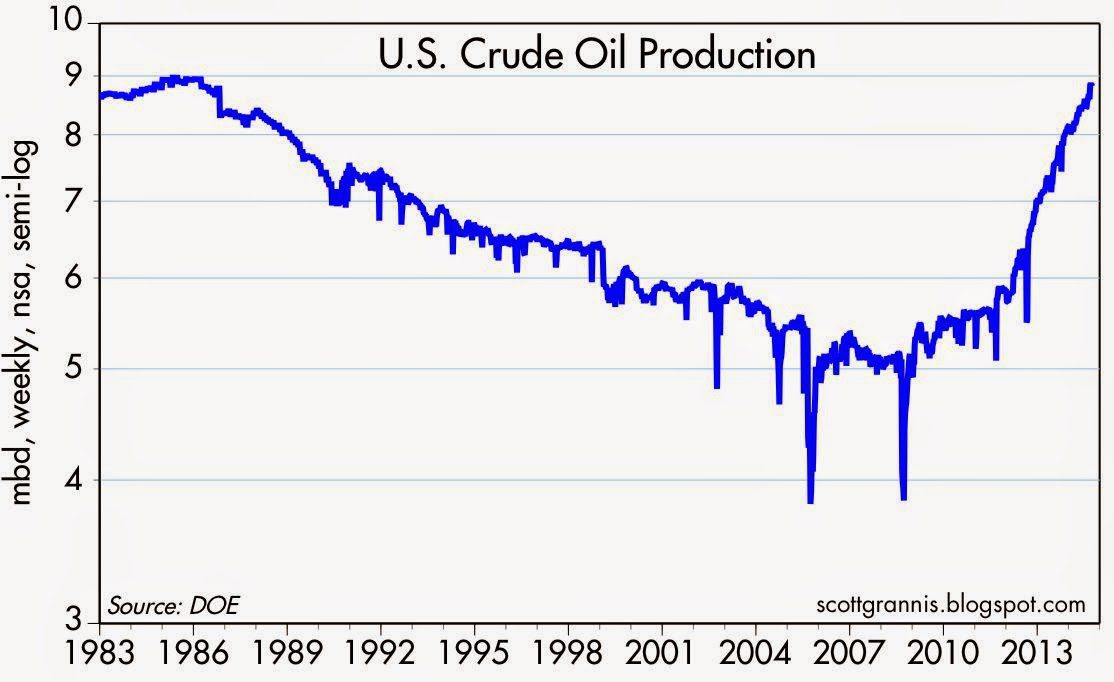
2. U.S. Crude Oil Production
Thanks to new fracking technologies, U.S. crude oil production has surged by a phenomenal 60% in just the past three years (it’s up almost 80% in the past 5 years), making the U.S. the largest producer of crude oil in the world…Meanwhile, all that new crude has created tens of thousands of new jobs and, as a welcome side-effect, has given us abundant supplies of very cheap natural gas, which in turn gives U.S. energy-intensive industries a huge leg up on their overseas competitors.
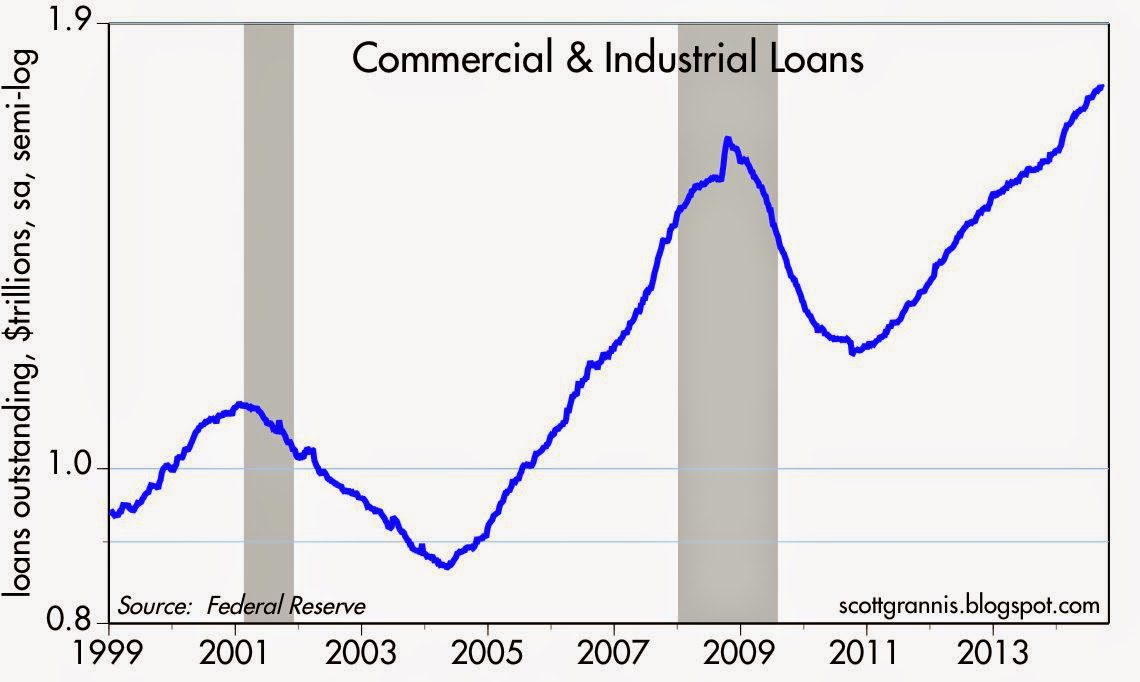
3. Bank Lending to Small- & Medium-sized Businesses
Since mid-January, just after the Fed announced the tapering and eventual demise of QE3, bank lending to small and medium-sized businesses (see chart below) has expanded at a 13.6% annualized pace. This reflects growing confidence on the part of banks and businesses. The tapering of QE (which is almost over) has not resulted in any reduction in the availability of credit. On the contrary.
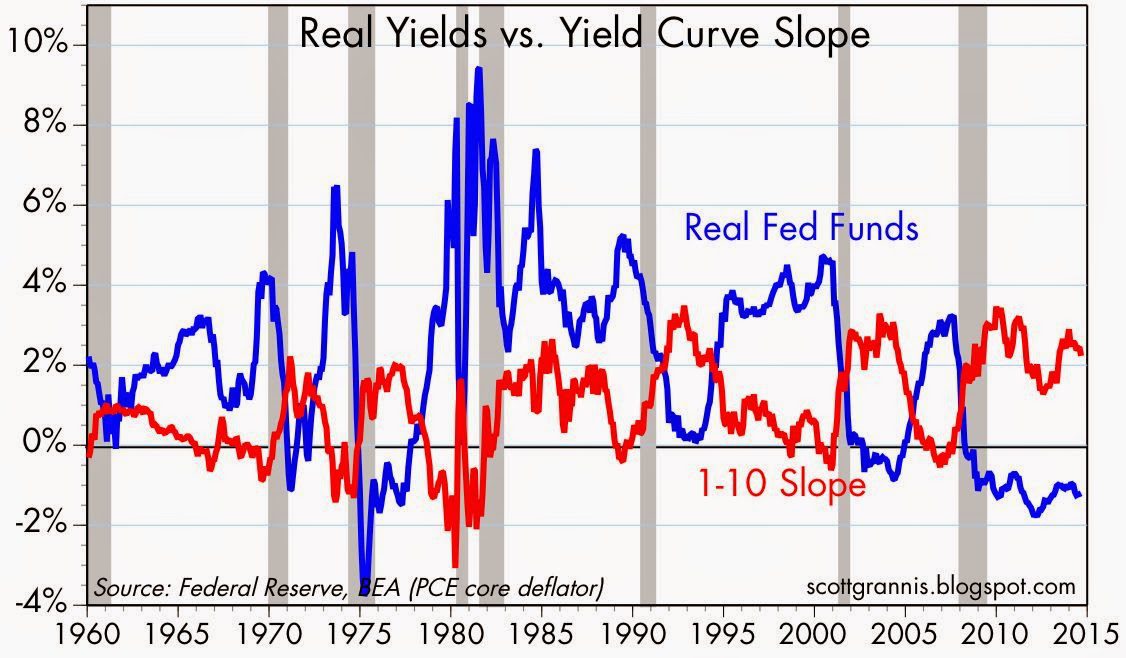
4. Monetary Policy
As the chart below shows, every recession in the past 60+ years has been preceded by a significant tightening of monetary policy. Tight money shows up in high and rising real short-term interest rates (the blue line) and a flat to inverted yield curve (the red line). Today these two variables tell us that monetary policy is still very accommodative, and as such poses no threat to growth. It would take an awful lot of tightening to change that picture, and that is not likely to happen for at least the next 1-2 years.
5. Mid-term Election Results
Then there is the prospect—increasingly likely—that the Republicans take over control of the Senate after next month’s elections. At the very least this could be the high-water mark for Big Government. In the years to come we could see regulatory burdens declining instead of increasing; marginal tax rates could ease instead of becoming ever-more burdensome; corporate tax burdens could decline, allowing U.S. corporations to better compete in the world and attracting rather than repelling capital.
Conclusion
As long as the U.S. economy avoids recession, equities are likely to continue to climb recurring walls of worry.
Editor’s Note: The author’s views and conclusions in the above article are unaltered and no personal comments have been included to maintain the integrity of the original post. Furthermore, the views, conclusions and any recommendations offered in this article are not to be construed as an endorsement of such by the editor.
*http://scottgrannis.blogspot.ca/2014/10/stocks-climb-walls-of-worry.html
If you liked this article then “Follow the munKNEE” & get each new post via
- Our Newsletter (sample here)
- Twitter (#munknee)
Related Articles:
1. How Will the Markets Perform For the Balance of 2014?
The S&P 500 just extended its winning streak to seven straight quarters, and it’s reasonable to wonder just how long it can continue…[That being said, however,] investors often enjoy a strong wind at their back in the fourth quarter, based on seasonal patterns and stock market history. Will 2014 be different [or will, as history suggests,] investors find a shiny new quarter during the next three months? [This article looks at these patterns to come to a better understanding of how the markets likely will perform for the balance of 2014.] Read More »
2. How Favorable Are Conditions For Stock Market? You’ll Be Surprised
Our “Barnyard” analysis from a year ago resulted in 6 out of 8 points indicating that the market would be favorable over the next 6-18 months. That has come true, with the S&P 500 up nearly 20% since then. We expect many will be surprised by the latest Barnyard Forecast which we present below. Read More »
3. What Are the Most Important Stock Market Drivers Forecasting?
In our view, the four primary drivers of market valuations are earnings, dividends, interest rates and inflation, of which two stand out above the others as being the most important. We look at each factor and then conclude with what it means for stocks. Read More »
4. Is the S&P 500 Overvalued? Here’s an Assessment
The S&P 500 has rallied for three years in a row, without a significant correction. This puzzles many observers who consider equities to be overvalued. Many experts predicted a correction (or worse) this year – after predicting one last year which has not happened – so how high is the S&P 500 valuation, after all? Read More »
5. Don’t Fear End of QE or Beginning of Higher Interest Rates – Here’s Why
The Fed and the bond market are responding appropriately to declining risk aversion and a somewhat improved economic outlook. There is no reason to fear the end of QE or the beginning of higher short-term interest rates. Let me explain further. Read More »
6. Are We In A Pre-crisis Period? A Look At 8 Possible Triggers
The frequency of financial crises and recessions is quite high: on average, there is one crisis every 58 months (using data from the US National Bureau of Economic Research). In other words, statistically speaking, we should expect the beginning of the next crisis in April 2015, which would end by March 2016. There are 8 possible scenarios that could cause the next crisis. Let’s take a look at each. Read More »
7. Divergence of U.S. & Euro Area Economies Is Dramatic – and Tragic! Take a Look
[Charts have the ability to clearly illustrate various situations and no 2 could be more so than the following charts] on the incredible divergence in the U.S. economy and the European economy as it related to the extent of unemployment and industrial production in each region. Take a look. It’s truly amazing – truly tragic. Read More »8. Markets & Economy NOT Topping Out & Ready to Roll Over – Here’s Why
Sure, the market is getting more and more expensive, debt levels are still high around the globe, and the Drudge Report assures us daily that the world is going to hell in a handbasket, but does this signal the end is near for stocks and the economy? This article presents 4 “big picture” charts or indicators to help determine whether the markets and economy are topping out and ready to roll over. Let’s take a look. Read More »


