Register to “Follow the munKNEE“ and automatically receive all articles posted
Whenever the BLS posts their monthly CPI there’s always the same response from critics that the index is flawed. That’s fine. I think a healthy dose of skepticism regarding government data is perfectly good. So let’s take a look at some independent gauges to see where prices are.
So writes Cullen Roche (http://pragcap.com) in edited excerpts from his article* entitled What Do The Independent Inflation Gauges Say?.
This article is presented compliments of www.munKNEE.com (Your Key to Making Money!) and may have been edited ([ ]), abridged (…) and/or reformatted (some sub-titles and bold/italics emphases) for the sake of clarity and brevity to ensure a fast and easy read. Please note that this paragraph must be included in any article re-posting to avoid copyright infringement.
Roche goes on to say in further edited excerpts:
Here’s what all the independent inflation gauges have to say compared to the “official” CPI:
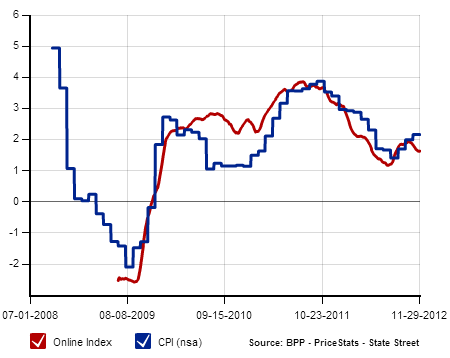
1. MIT’s Billion Prices Project
According to MIT’s Billion Prices Project [Read: Real-time Inflation Data is Now Available – Finally] inflation is running about 1.7% almost perfectly in-line with the BLS:
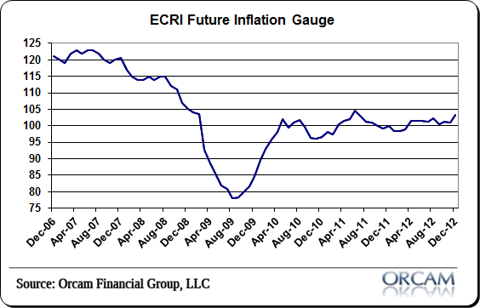
2. ECRI’s Future Inflation Gauge
The ECRI’s Future Inflation Gauge is showing prices at a bit higher level. The index was up to 104 from 98.9 last December. That’s a 5.2% increase. Not exactly in-line with the BLS data.
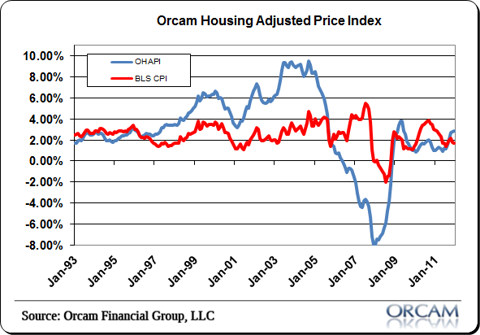
3. Orcam Housing Adjusted Price Index
The Orcam Housing Adjusted Price Index was at 2.84% on the month. That’s a bit higher than the BLS data, but not far off.
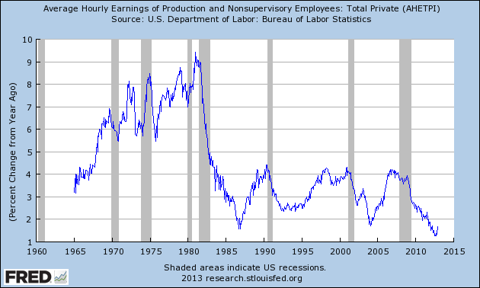
4. Hourly Earnings % Increase
Meanwhile, hourly earnings are near their lows at just 1.7%:
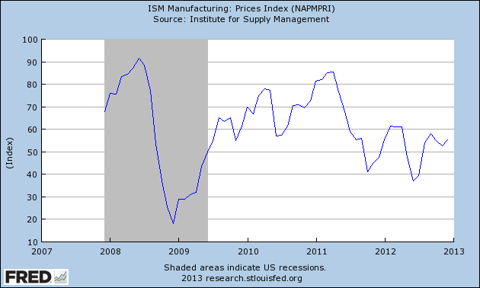
5. ISM Manufacturing Survey Price Level Increase
The ISM Manufacturing Survey showed a faster rise in prices to a level of 55.5 from 52.5 but it’s important to note that this is a diffusion index so prices are relatively benign when kept in perspective.
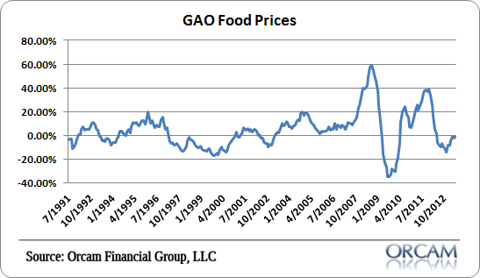
6. GAO Food Price Increases
What about food prices? According to the GAO food prices are actually deflating year over year at a rate of -0.7%.
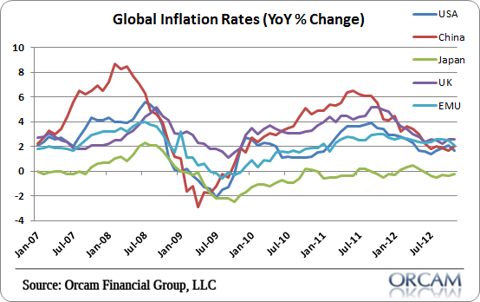
7. Global Inflation
What about global inflation? They’re almost universally in a disinflation:
8. Shadow Stats Alternative Index
Even ShadowStats, who has been wrong about hyperinflation for 5 years running [Read: Williams STILL Believes a Hyperinflationary Great Depression is Coming! Here’s Why], is registering their ShadowStats Alternate index at just above 5%. That’s certain to be on the high end of the inflation readings which means, even in the worst case scenario, inflation is about 1.5% above its historical average.
I think it’s healthy to remain skeptical of the BLS data. Their readings are definitely on the low end of the spectrum presented here but I think it’s also clear that they’re probably not far off from the true rates of inflation as most of these readings average out to something resembling the Orcam Housing Adjusted Price Index more than anything else.
Conclusion
All in all, the price data is fairly benign. Certainly nothing worth panicking over.
Editor’s Note: The author’s views and conclusions are unaltered and no personal comments have been included to maintain the integrity of the original article. Furthermore, the views, conclusions and any recommendations offered in this article are not to be construed as an endorsement of such by the editor.
*http://pragcap.com/what-do-the-independent-inflation-gauges-say
Register HERE for Your Daily Intelligence Report Newsletter
- It’s FREE
- Provides the “best of the best” financial, economic and investment articles to be found on the internet
- Is in an “edited excerpts” format to provide brevity & clarity to ensure a fast & easy read
- Don’t waste time searching for informative articles. We do it for you!
- Register HERE and automatically receive every article posted
- “Follow Us” on twitter & “Like Us” on Facebook
Related Articles:
1. The Big Mac Index Reveals the REAL Facts On U.S. Inflation!
A look at the trend in prices of the Big Mac clearly shows that investors are being penalized with higher inflation, lower income from bonds and certificates of deposit and being led to believe that the economy is growing better than it really is. [Let me explain.] Words: 1012; Charts: 2
2. Real-time Inflation Data is Now Available – Finally
Inflation is a significant measurement for the economic health of countries around the world but rates are often reported weeks after data is collected. To address this problem, two professors at MIT Sloan School of Management have launched the Billion Prices Project which is the first website to publish daily price indexes and provide real-time inflation estimates around the world. Words: 825
3. and the Winner of the DE-flation/IN-flation Battle is About to Be….?
Many investors are positioning their portfolios based upon their opinions as to whether or not we will encounter IN-flation or DE-flation. Well, what the MS Commodity Index (CRX) does over the next few weeks might tell us a good deal about how to best position one’s portfolio. Take a look at the latest CRX graph below for an indication.
4. It is VERY Important to Know Where the Inflation-Delation Pendulum Is to Invest Correctly – Do You?
Global investors are now being violently whipsawed by the decisions of central banks, as they switch between inflationary and deflationary policies. The choice governments now face is to allow a deflationary depression to finally purge the worldwide economy of its imbalances, or try to levitate real estate, equity and bond prices by printing massive quantities of their currencies.
5. Williams STILL Believes a Hyperinflationary Great Depression is Coming! Here’s Why
The U.S. economic and systemic-solvency crises of the last five years continue to deteriorate yet they remain just the precursors to the coming Great Collapse: a hyperinflationary great depression. The unfolding circumstance will encompass a complete loss in the purchasing power of the U.S. dollar; a collapse in the normal stream of U.S. commercial and economic activity; a collapse in the U.S. financial system, as we know it; and a likely realignment of the U.S. political environment.
6. These Indicators Say Inflation to Go to 4% Soon – and 6% by 2014
In response to the financial crisis of 2008, the Fed injected unprecedented levels of liquidity into the banking system. While inflation has been modest to date, an analysis of similar periods in history shows that it typically takes more than two years for the impact on consumer prices to be seen. Consequently, we are now at a pivotal point in the current cycle as Fed stimulus began more than two years ago. [Let me explain further.] Words: 2755
7. Official and ShadowStats Monthly Inflation Rates: 1872 to Present
[There is a considerable difference between the official BLS inflation rate (1.63%) and the ShadowStats’ alternative method of calculating consumer prices (9.07%) but] I believe that the optimum method is probably somewhere between the two. [Let me explain.] Words: 390 munKNEE.com Your Key to Making Money
