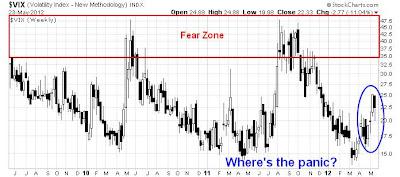
With stocks declining in the last few weeks all the various sentiment surveys point to excessive bearishness/excessive fear. That’s in spite of the fact that market based indicators such as the VIX Index are not showing very much fear at all. While this market is deeply oversold and due for a relief rally, these readings are suggestive that there is more downside before we see an intermediate term bottom. [Let me explain.] Words: 290
So says Cam Hui (www.humblestudentofthemarkets.blogspot.ca) in edited excerpts from his original article*.
Lorimer Wilson, editor of www.munKNEE.com (Your Key to Making Money!), has edited the article below for length and clarity – see Editor’s Note at the bottom of the page. This paragraph must be included in any article re-posting to avoid copyright infringement.
Hui goes on to say, in part:
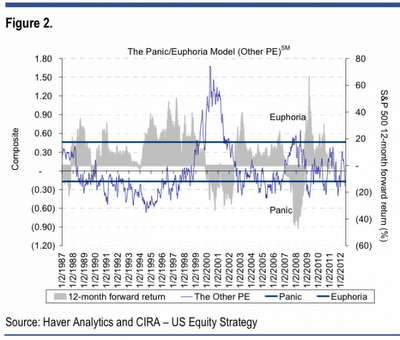
As an example, the Citigroup Panic/Euphoria Model is in the “panic” territory. The model is a contrarian indicator, which means high levels of panic mean it’s time to buy stocks. The model isn’t screaming buy yet but it’s worth noting that it’s pretty reliable. Last October, it predicted a 98 percent chance of a double-digit return in stocks, and it was right.
Click to enlarge images
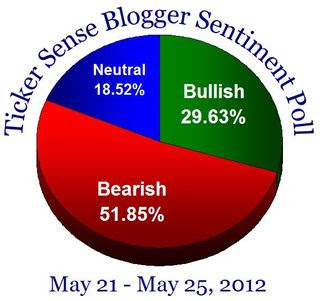
The Ticker Sense Blogger Survey, to which I contribute and voted “bearish” last week, also confirm the observation that there are too many bears.
The VIX Index, on the other hand, is not showing very much fear at all in spite of all these sentiment surveys pointing to excessive bearishness.

Conclusion
Remember, [it is] what they do, not what they say. While…this market is deeply oversold and due for a relief rally, these readings are suggestive that there is more downside before we see an intermediate term bottom.
*http://humblestudentofthemarkets.blogspot.ca/2012/05/not-enough-panic.html (To access the above article please copy the URL and paste it into your browser.)
Editor’s Note: The above article may have been edited ([ ]), abridged (…), and reformatted (including the title, some sub-titles and bold/italics emphases) for the sake of clarity and brevity to ensure a fast and easy read. The article’s views and conclusions are unaltered and no personal comments have been included to maintain the integrity of the original article.
Related Articles:
As editor of this site I have never been a cheerleader for any author but I must make an exception in this case. We all have read analysis after analysis that just doesn’t make the cut but those of Dr. Yu do, as this one so clearly demonstrates. If you only have time to read one article as to where the price of gold, silver, mining stocks, crude oil, the stock market, U.S. treasuries and the U.S. Dollar index are going his analyses are a MUST read! Take a look. Words: 1226
2. This New ‘Peak Fear’ Indicator Gives You an Investment Edge
We are at a major crossroads in the equity and bond markets. We could see a major ‘risk-on’ rally in the S&P 500 BUT if no equity rally ensues, and U.S. Treasury note yields keep falling, then something terrible is about to strike at the heart of the global capital markets…. [As such, it is imperative that you keep a close eye on this new ‘Peak Price’ indicator. Let me explain.] Words: 450
3. This New Research Suggests: 86% Liklihood of Stock Market Increasing 14% in Next 12 Months
Analysts at Bank of America-Merrill Lynch have created the Global Wave, a compilation of seven global indicators designed to provide a comprehensive assessment of trends in global economic activity. The compiled data allows investors to predict equity market performance and…[it indicates that there is an 86% liklihood that we will experience a 14.2% increase, on average, in the performance of global stock markets in the next 12 months. Read more about the “Global Wave” below.] Words: 462
4. The Bull Market In Equities is NOT Over! Here’s Why
In spite of all the bearishness out there – the S&P 500 falling to 1,000 (David Tice),the market is overbought (John Hussman), its looking like the bear market of 2011 all over again (David Rosenberg), for example – I tend to disagree for 4 fundamental reasons. Let me explain. Words: 595
5. Ignore Guru Opinions: 66% Get It WRONG More Than 50% of the Time! Here’s How They Compare
Can experts, whether self-proclaimed or endorsed by others (publications), provide reliable stock market timing guidance? Do some experts clearly show better intuition about overall market direction than others? [NO is the answer to the first question and YES to the second. Let us explain how we came to those conclusions.] Words:360
 munKNEE.com Your Key to Making Money


